Verifying the Verifiers: Towards Autonomous Policy Evaluation
Abstract
AI is now capable of producing policy evaluation papers, end to end, that look like real papers. But are they to be trusted? If they can be, the technology would open the door to evidence generation at unprecedented scale: cheap, rapid, and global. Checking thousands of papers by hand is infeasible, so verification itself must be automated — which raises the question of whether the verifiers can be trusted. Here, we study the reliability of automated verifiers powered by LLMs. We first develop a versioned taxonomy, the CRED codebook (Classification of Research Errors and Defects), followed by a benchmark and scoring method that quantify a verifier's ability to detect errors under that taxonomy. This lets us compare verifiers and trace the frontier between cost and detection recall over time. We find remarkable recent progress. Eighteen months ago, with the first ‘reasoning’ models, detection recall was around 30% — more than two of every three errors missed. By February 2026, the best models missed one in six. In July 2026, the first model reached 99% recall (Codex 5.6 Sol), suggesting a new era for verifiers.11. The 99% figure is Codex 5.6 Sol's detection recall on the single-error pool. Precision uses Codex 5.5 high, which was the recall leader when selected. The two-error and replicate panels cover selected configurations but do not yet include every newest model.22. Cf. Andrej Karpathy's “march of nines”: every additional nine of reliability takes roughly as much work as all the nines before it — a framing from self-driving. Costs have collapsed alongside: the cheapest price of 50% recall fell roughly 90 times over the past year, and the cheapest price of 20% recall fell more than 400 times in eight months. Ensembles built largely from models with open weights prove highly cost effective. Reliability, however, is not solved: recall degrades when a paper contains multiple errors, and confidence scores remain too poorly calibrated to decide when human review is unnecessary. We conclude by discussing what is verifiable in principle and what is not. Together, our results suggest that automated verification of policy evaluation research may soon be feasible at scale, reliably and cheaply.
Acknowledgements. We thank Bente Presse for expert adjudication in the precision evaluation, Fabian Schupp and seminar participants at the European Central Bank, Fabian Garavito and seminar participants at the UK Financial Conduct Authority, and seminar participants at the Excellence Foundation UZH, ETH Zurich, the Mellichamp Initiative in Mind & Machine Intelligence, and the Bocconi LEAP Conference. We gratefully acknowledge financial support from the Google Cloud Research program.
Current benchmark status. Capability sample: 80 configurations. Interference panel: 18 configurations. Repeatability panel: 10 configurations. Updated September 6, 2026.
1 · Introduction
The cost of producing social science research appears to be collapsing. Core parts of the research generation process — ideation, data collection, analysis, and writing — are increasingly being powered using AI.33. Lu et al. (2024), The AI Scientist; Schmidgall et al. (2025), Agent Laboratory; Si, Yang & Hashimoto (2024) on LLM-generated research ideas. The reduction in cost could, in principle, open the door to standardized policy evaluation at scale, given the vast unexplored space of policies around the world combined with the ever-growing availability of high-quality data. Done at scale, evidence-based policy making could therefore stand on much more solid ground.
However, if AI-generated research is unreliable, filled with errors, then production at scale is a bad idea. Hence, verification becomes key. Here, just as on the generation side, while the cost of verifying output may also be falling, whether we can reliably leverage AI to act as an automated verifier remains an open question. In short, the frontier between cost and detection recall for automated verifiers is unknown. We attempt to identify it.
Our setting is the Autonomous Policy Evaluation (APE) project, where from January to April 2026 we generated 1,000 empirical economics papers on policy evaluation from across the globe.44. Policy evaluation typically concerns a policy such as a tax, subsidy, law, or regulation and its causal effect on one or more outcomes. Estimating that effect requires observational or randomized data and an empirical strategy. Until now, the quality of these papers was unknown to us: reviewing them all was precluded by the cost of skilled labor. We have now completed automated scans of the 1,000-paper corpus; analysis and report writing are in progress. Any such assessment is only as good as the LLM producing it: the verifier must itself be verified. This is a version of the recursive monitoring problem studied by Rahman (2012): delegating potentially costly verification to a monitor shifts the question to how the monitor itself can be assessed. Moreover, given the plethora of possible models and harnesses that could be leveraged, in principle many verifiers could be used.
We pursue the ideal that anything that can be verified, should be verified. In practice, it is not obvious what that entails. For example, imagine that an AI-generated paper claims that it studies some policy where it downloaded panel data from the U.S. Census Bureau, used a two-way fixed effects regression approach, and estimated a statistically significant positive effect of 15 percentage points with a p-value of 0.02. Can an automated verifier truly scrutinize these claims? A good verifier should. For each, there is a ground truth, and if there is an error, a reliable verifier should always detect and report it.
To make progress, we develop a versioned taxonomy for classifying errors in policy evaluation research. We call it the CRED codebook, short for ‘Classification of Research Errors and Defects’. The codebook is developed in order to detect critical types of errors that a policy evaluation paper could have. We do not claim that CRED covers all possible verifiable errors and defects that could arise in APE. However, we do believe that it covers necessary, first-order concerns required by a verifier. In fact, much like in other domains where taxonomies evolve over time, we expect CRED to evolve. (For example, in human disease classification, the International Classification of Diseases is on its tenth revision, ICD-10.) Here, we report results using our current version, CRED v0.92. This also means that we only report benchmark results on a verifier's ability to detect errors, given an error classification scheme. Armed with CRED, we concretely ask three questions:
- What is the likelihood that a verifier detects a true error?
- How is this capability changing over time, as new models get released?
- Where is the cost-effective Pareto frontier?
Below, we report results after describing in detail how we overcome conceptual and practical challenges. In short, challenges fall into three broad domains: 1) establishing a classification scheme and measuring the ground truth, 2) developing deterministic components of verifiers that minimize the stochastic properties of LLMs, 3) searching for the most cost-effective verifier. To our knowledge, CRED is the first classification scheme for policy evaluation research. It is tailored to help solve a key bottleneck for Project APE, where the north star is end-to-end autonomous policy evaluation. We are also unaware of any previous work identifying the frontier between cost and detection recall for automated verifiers in empirical economics.
3 · Methodology: The CRED Benchmark
This section outlines how we use the CRED benchmark to solve our first two challenges: developing a taxonomy of errors for which we can measure ground truth, and creating a deterministic scoring mechanism that eliminates variability from scoring with an LLM-judge. We achieve this by injecting known CRED errors into papers that demonstrably reproduce, and by scoring each verifier with a deterministic text match rather than an LLM judge.
We distinguish four components throughout. The CRED codebook is the versioned taxonomy of error classes. The CRED benchmark suite is the collection of host papers and injected errors used to test detectors.88. To preserve CRED as a valid benchmark for future models, we do not publicly release the mutated benchmark instances, their answer key, or raw detector outputs that reveal benchmark content. Public release could allow these materials to enter training data or be used for targeted tuning. A model could then learn answers specific to the benchmark without acquiring the underlying ability to verify unfamiliar papers (Jacovi et al. 2023). This mirrors Rahman's trick question logic: the test is informative only while its answer remains hidden from the monitor. We will, however, release the detector prompt template, output schema, scoring and analysis code, configuration metadata, and derived data needed to reproduce the reported analyses and figures shortly after publication. The scoring protocol deterministically matches detector findings to those injected errors. A detector configuration is the particular model, prompt, reasoning-effort setting, and delivery system being evaluated.
The Replication and Build Defects (RBD) gate is the deterministic foundation of our benchmark: it establishes whether a replication package reproduces before we use its paper as a host into which we inject errors. The RBD pipeline first runs the package's R code end to end and records whether execution succeeds. For packages that pass this step, it then compares the regenerated tables with the tables in the paper, allowing for rounding. Together, these results form the reproduction record. We run RBD first to select host papers that reproduce, and again on every error-injected copy used as a benchmark instance. This stage is purely deterministic: it runs the supplied code and records its output. The LLM detectors receive this reproduction record; they do not execute the code themselves. A failure to execute is therefore directly observable in the record, whereas other errors require comparing the manuscript, tables, and code.
The papers used as hosts are drawn from the APE corpus of 1,000 papers. A paper passes RBD when its code executes successfully and its regenerated tables match the tables in the paper. The gate yields 144 eligible papers. The design is mutation testing applied to policy evaluation: we insert known errors into papers that demonstrably reproduce and measure each detector's ability to identify them.99. Mutation testing: DeMillo, Lipton & Sayward (1978), “Hints on Test Data Selection,” IEEE Computer; Jia & Harman (2011) survey, IEEE Trans. Software Engineering. Because the host self-reproduces before mutation, the injected edits are the only known discrepancies.1010. Hosts may still contain latent defects we did not inject, but these cannot inflate recall: a finding earns credit only if it quotes the injected edit itself.
The 100 hosts are not a random sample, and we make no claim to represent a population. Passing RBD is the sole benchmark eligibility criterion. From the 144 papers that pass, we selected 100 for feasibility and the planned chapter mix, as we aim to identify additional errors.1111. On design-based rather than sampling-based inference: Abadie, Athey, Imbens & Wooldridge (2020), Econometrica. On benchmarks as instruments, not surveys: Raji et al. (2021), NeurIPS Datasets and Benchmarks. Each injected error comes from our CRED taxonomy, whose four chapters classify four types of observable defects:1212. The codebook measures reproducibility in papers, not correctness (National Academies 2019; Goodman, Fanelli & Ioannidis 2016, Science Translational Medicine); codes describe what is visible in the paper and its code, so no author intent is inferred.
- Prose–Table Inconsistency (PTI). A value or claim in the manuscript disagrees with the corresponding cell in the tables. This can be, for example, a numeric mismatch, a sign flip, a significance flip, or a unit disagreement.
- Paper–Code Inconsistency (PCI). The manuscript disagrees with what the code does. Examples: a different estimation choice, an inaccurately stated sample, treatment timing, or variable construction.
- Execution/Reproducibility (EXE). The package does not self-reproduce: the code fails to run end to end, or a rendered table cannot be regenerated from the current code.
- Data Integrity (DAT). The inputs are synthetic, fabricated, or transformed using outcome values. For example, the code may generate synthetic data instead of using real data.
We designed and injected each error using the codebook and examples from the corpus as references. We reviewed every mutation individually before applying it to a host. Because we control both the original package and the exact injected edit, we know the error ground truth and location exactly.1313. The mutated segments were created in June 2026, after the training-data cutoff of the models in the initial benchmark suite; more fundamentally, ground truth is agreement within the package — so a memorized unmutated package has no effect on the outcome. Cf. Kohler et al. (2026, ETH Zurich), who find no pre- versus post-cutoff performance difference in the adjacent reproduction setting. From the same 100 hosts we construct three arms: arms A and B each insert one error per host (pooled as the single-error pool, n=200), and arm AB inserts both errors at once. Recall can then be compared on the same error with and without a second error present. Unless a figure says otherwise, results use the single-error pool (n=200), so every model is scored on the same 200 instances under the same protocol.
During benchmark construction, we also assigned each error a coarse severity annotation based on its likely consequence for the paper: severe errors could invalidate a headline result, such as through corrupted input data; moderate errors are materially wrong but contained; and minor errors are localized issues, such as a rounding inconsistency. These are reviewed benchmark annotations, not independently validated severity ground truth, so comparisons by severity are descriptive.
From paper samples to scored results
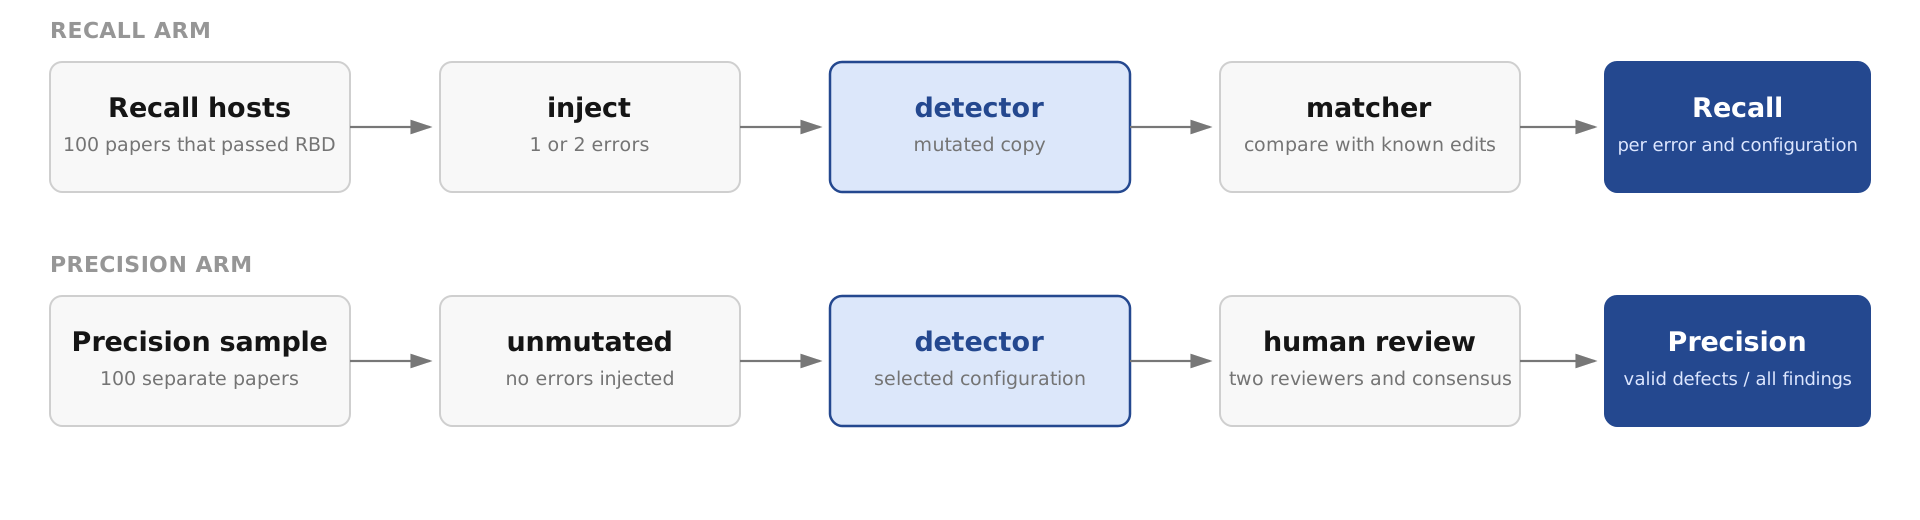
Figure 1: The recall arm takes a host that passed RBD, injects one or two errors, runs the detector on the mutated copy, and mechanically matches its findings to the injected edits. The precision arm runs the selected detector configuration on a separate sample of 100 unmutated papers and sends every finding to human review. Because each recall host reproduces before mutation, the injected edits are the only known discrepancies, and scoring in the recall arm is tied to them.
One injected defect per chapter
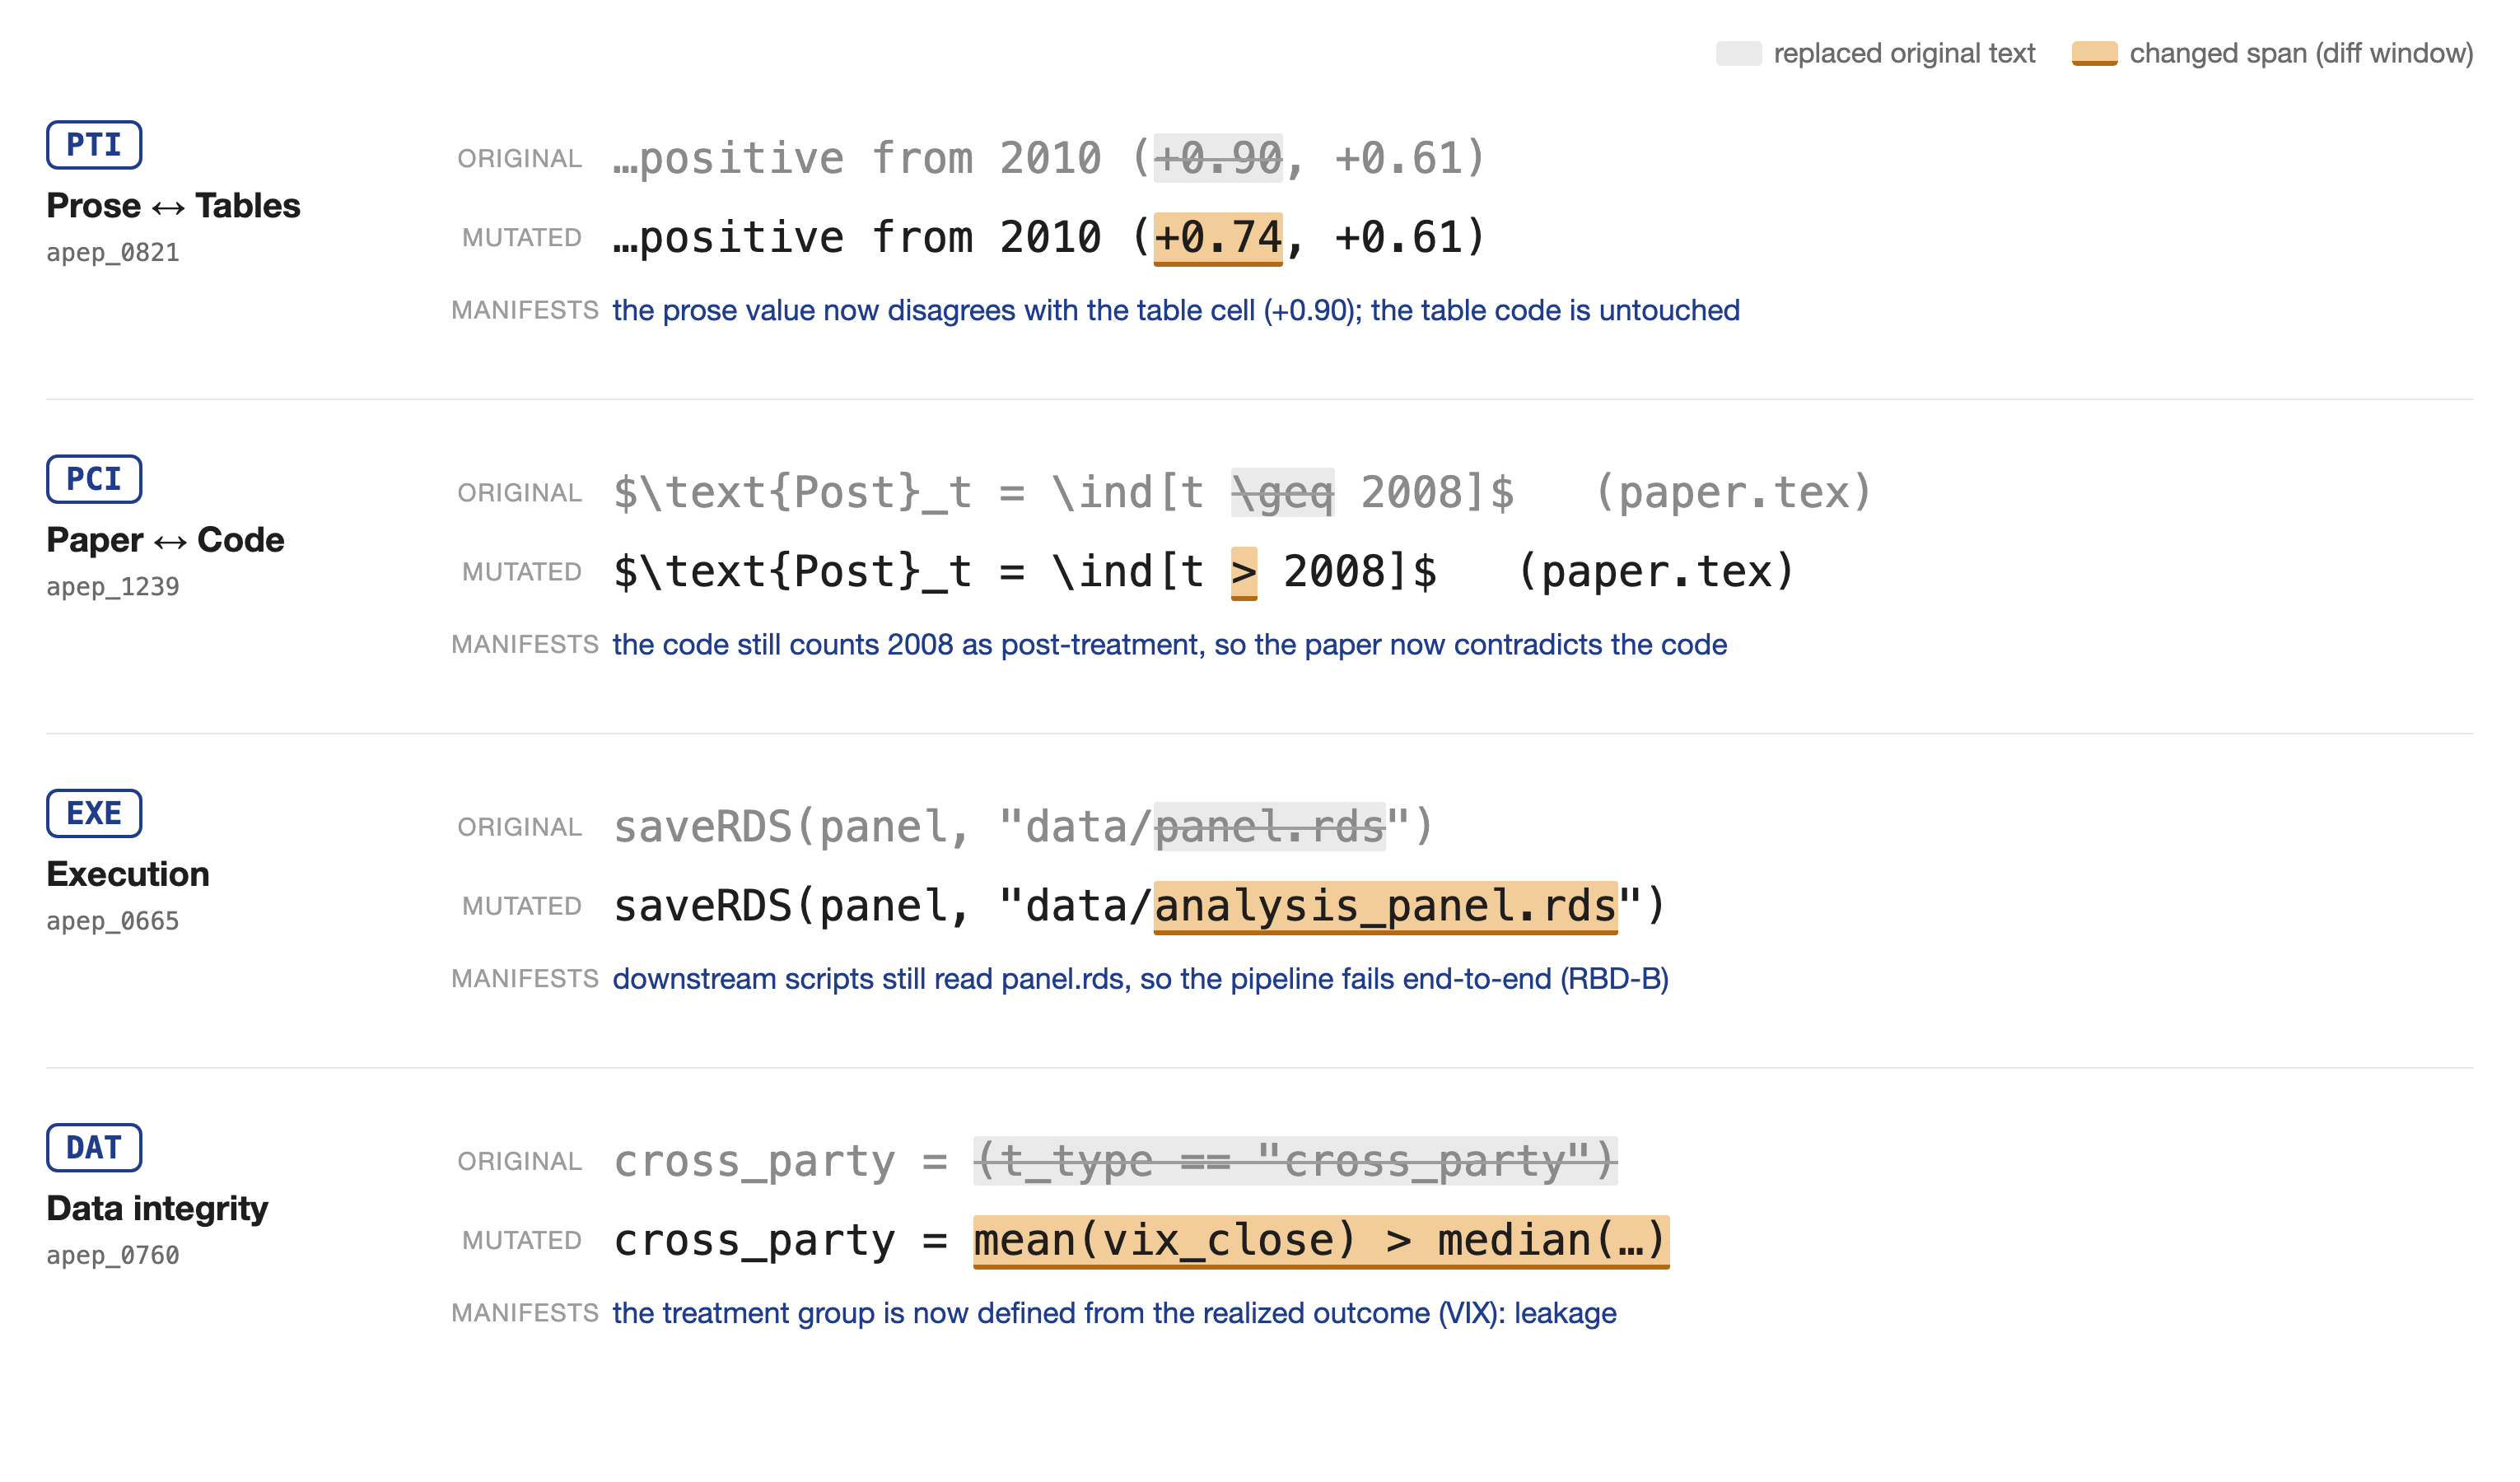
Figure 2: Each row shows the exact edit injected into a host that passed RBD, original versus mutated text with the changed span highlighted, and where the defect becomes visible. All edits are real injected errors from the benchmark. Each defect is assigned to the pair of files a competent auditor would need to inspect to see it.
The detectors
We define a “configuration” as a combination of an LLM, a prompt, and a reasoning-effort setting. Configurations come in two types: single-shot configurations, which receive the replication package combined with the prompt in a single API call, and agentic configurations, which receive the same codebook and task instructions but are provided the replication folder as a workspace, with read-only tools. For comparability across these two types, every configuration uses the same codebook, task instructions, and output specification. Agentic harnesses enforce those fields with a JSON Schema; single-shot responses are parsed against the same fields. Reasoning-effort labels are specific to the models and ordinal only within a model family; for example, a “high” setting is not necessarily assumed to be comparable across families. After reading the replication package for a paper, every configuration returns a structured list of findings: verbatim quote, location, chapter, one-sentence rationale, proposed severity, and confidence (0–100%). While we do not claim to have tested every available model, we generally selected models that were viewed as near the frontier on common benchmarks at the time or that offered a promising price point. We select configurations to span three axes that plausibly shape verification cost and capability: token price, which ranges over roughly two orders of magnitude; open- versus closed-weight release; and developer geography.1414. A configuration also includes the delivery harness, where applicable (for example, Claude Code), and the harness version used for the run. The same model run through a different harness is a different configuration.
To compare configurations on a common metric, we reconstruct an equivalent API cost per paper from recorded token counts using public prices as of July 14, 2026. For single-shot configurations, this closely corresponds to the metered API charge from OpenRouter. Agentic configurations were run through subscriptions, so their plotted cost is an API-equivalent price. Plausible price changes do not change the ordering of the frontier.
Three analysis samples. The analyses use one “capability” sample and two “analysis” subsets. The capability sample contains every configuration with completed single-error arms A and B and currently includes 80 configurations. The interference panel contains the 18 configurations that also completed the two-error AB arm. The repeatability panel contains the 10 configurations with an independent rerun on the same 100 A instances. A configuration enters each sample only after completing the runs required for that analysis. Finally, failed calls and refusals count as misses, and the sample used by each figure is stated in its subtitle.
Scoring
We choose to score the findings without using an LLM to avoid potential measurement error. Rahman describes checks for which the principal knows the correct answer as “trick questions”: because the answer is known, the monitor can be scored directly. Injected CRED errors serve the same function. Using another LLM as the judge would move the monitoring problem back one step because the judge would itself need to be evaluated. Its verdict can change with the prompt, judge model, temperature, or answer order. LLM judges can also favor verbose or self-generated answers, and their agreement with human judgments varies substantially across tasks.1515. LLM judge outputs vary with model and measurement choices (Messing 2026) and answer order (Wang et al. 2023). They carry verbosity bias (Zheng et al. 2023, NeurIPS) and self-preference (Panickssery, Bowman & Feng 2024, NeurIPS), while their agreement with human experts varies across tasks (Bavaresco et al. 2024). Deterministic matching instead makes the score reproducible: given the same finding and injected error, it returns the same result.
We credit findings using deterministic string matching, and the setup is as follows. Every detector provides its findings in a fixed format, containing a verbatim quote (the evidence), a location, a rationale (which is not used for scoring), and a chapter label. A finding ties to the injected error if its quoted evidence contains the changed segment itself (plus a few characters of context); quoting surrounding text is not sufficient. In the two-error (AB) arm, findings are matched one-to-one to errors (each finding can be credited against at most one error, and vice versa), so a single quote cannot be credited twice. A quote can be credited in three ways (Figure 3):
- Window containment: the quote contains the changed segment plus a few (4–12) characters of context. Containment is verified twice: on the raw text, and after canonicalization (LaTeX stripped, math symbols and typography normalized, whitespace removed).
- Long-edit fragment: for long inserted or replaced segments, which detectors quote in pieces, the quote must share a contiguous substring of at least 18 characters with the modified segment itself.
- Short-edit full containment: for edits too short to form a distinctive window, the quote must contain the entire edited text, original or mutated, verbatim.
These character cutoffs were selected while developing the matching logic, after auditing cases in which the matcher either credited the wrong finding or failed to credit a genuine detection. The matcher first requires the changed text together with 12 characters of context on each side, which makes accidental matches unlikely. It loosens this requirement to four characters when a detector quotes only the changed value and its immediate context. For long edits, an 18-character overlap with the changed text allows truncated quotations while still requiring a substantial verbatim match. We fixed these rules and applied them uniformly to every error and detector configuration.
On papers where the injected error is EXE, a finding labeled EXE that quotes the RBD result is credited, since an execution failure shows up in the execution run result, and there is no edited line to quote. This is the only crediting rule that uses the finding's chapter label; requiring EXE here prevents unrelated references to RBD from matching. These rules can under-credit correct paraphrases, so we interpret reported recall conservatively.1616. Concretely: of the strongest run's two uncredited errors (Codex 5.6 Sol, 99%), one was in fact found and quoted verbatim — but the quote ended two characters after the changed digit, short of the matcher's context window, so it earned no credit. The full specification, with window sizes, thresholds, and a worked example, is in Appendix D.
The scoring measures two tasks:
- Detection (localization): an injected error counts as detected if a finding ties to it.
- Attribution (chapter-correct): an injected error additionally counts as attributed if the tying finding's chapter label equals the error's true chapter.
Attribution is therefore a strict subset of detection, highlighting the gap between finding an error and correctly assigning it to a CRED chapter. An example of this is as follows: the detector quotes the exact line where the paper contradicts its own code (a PCI error), but classifies it as a prose–table inconsistency (PTI), which is detection without attribution (the dominant pattern in the data; section 4). We report conditional attribution, which is the share of correctly labeled errors, conditional on detection.
The three crediting rules of the deterministic matcher
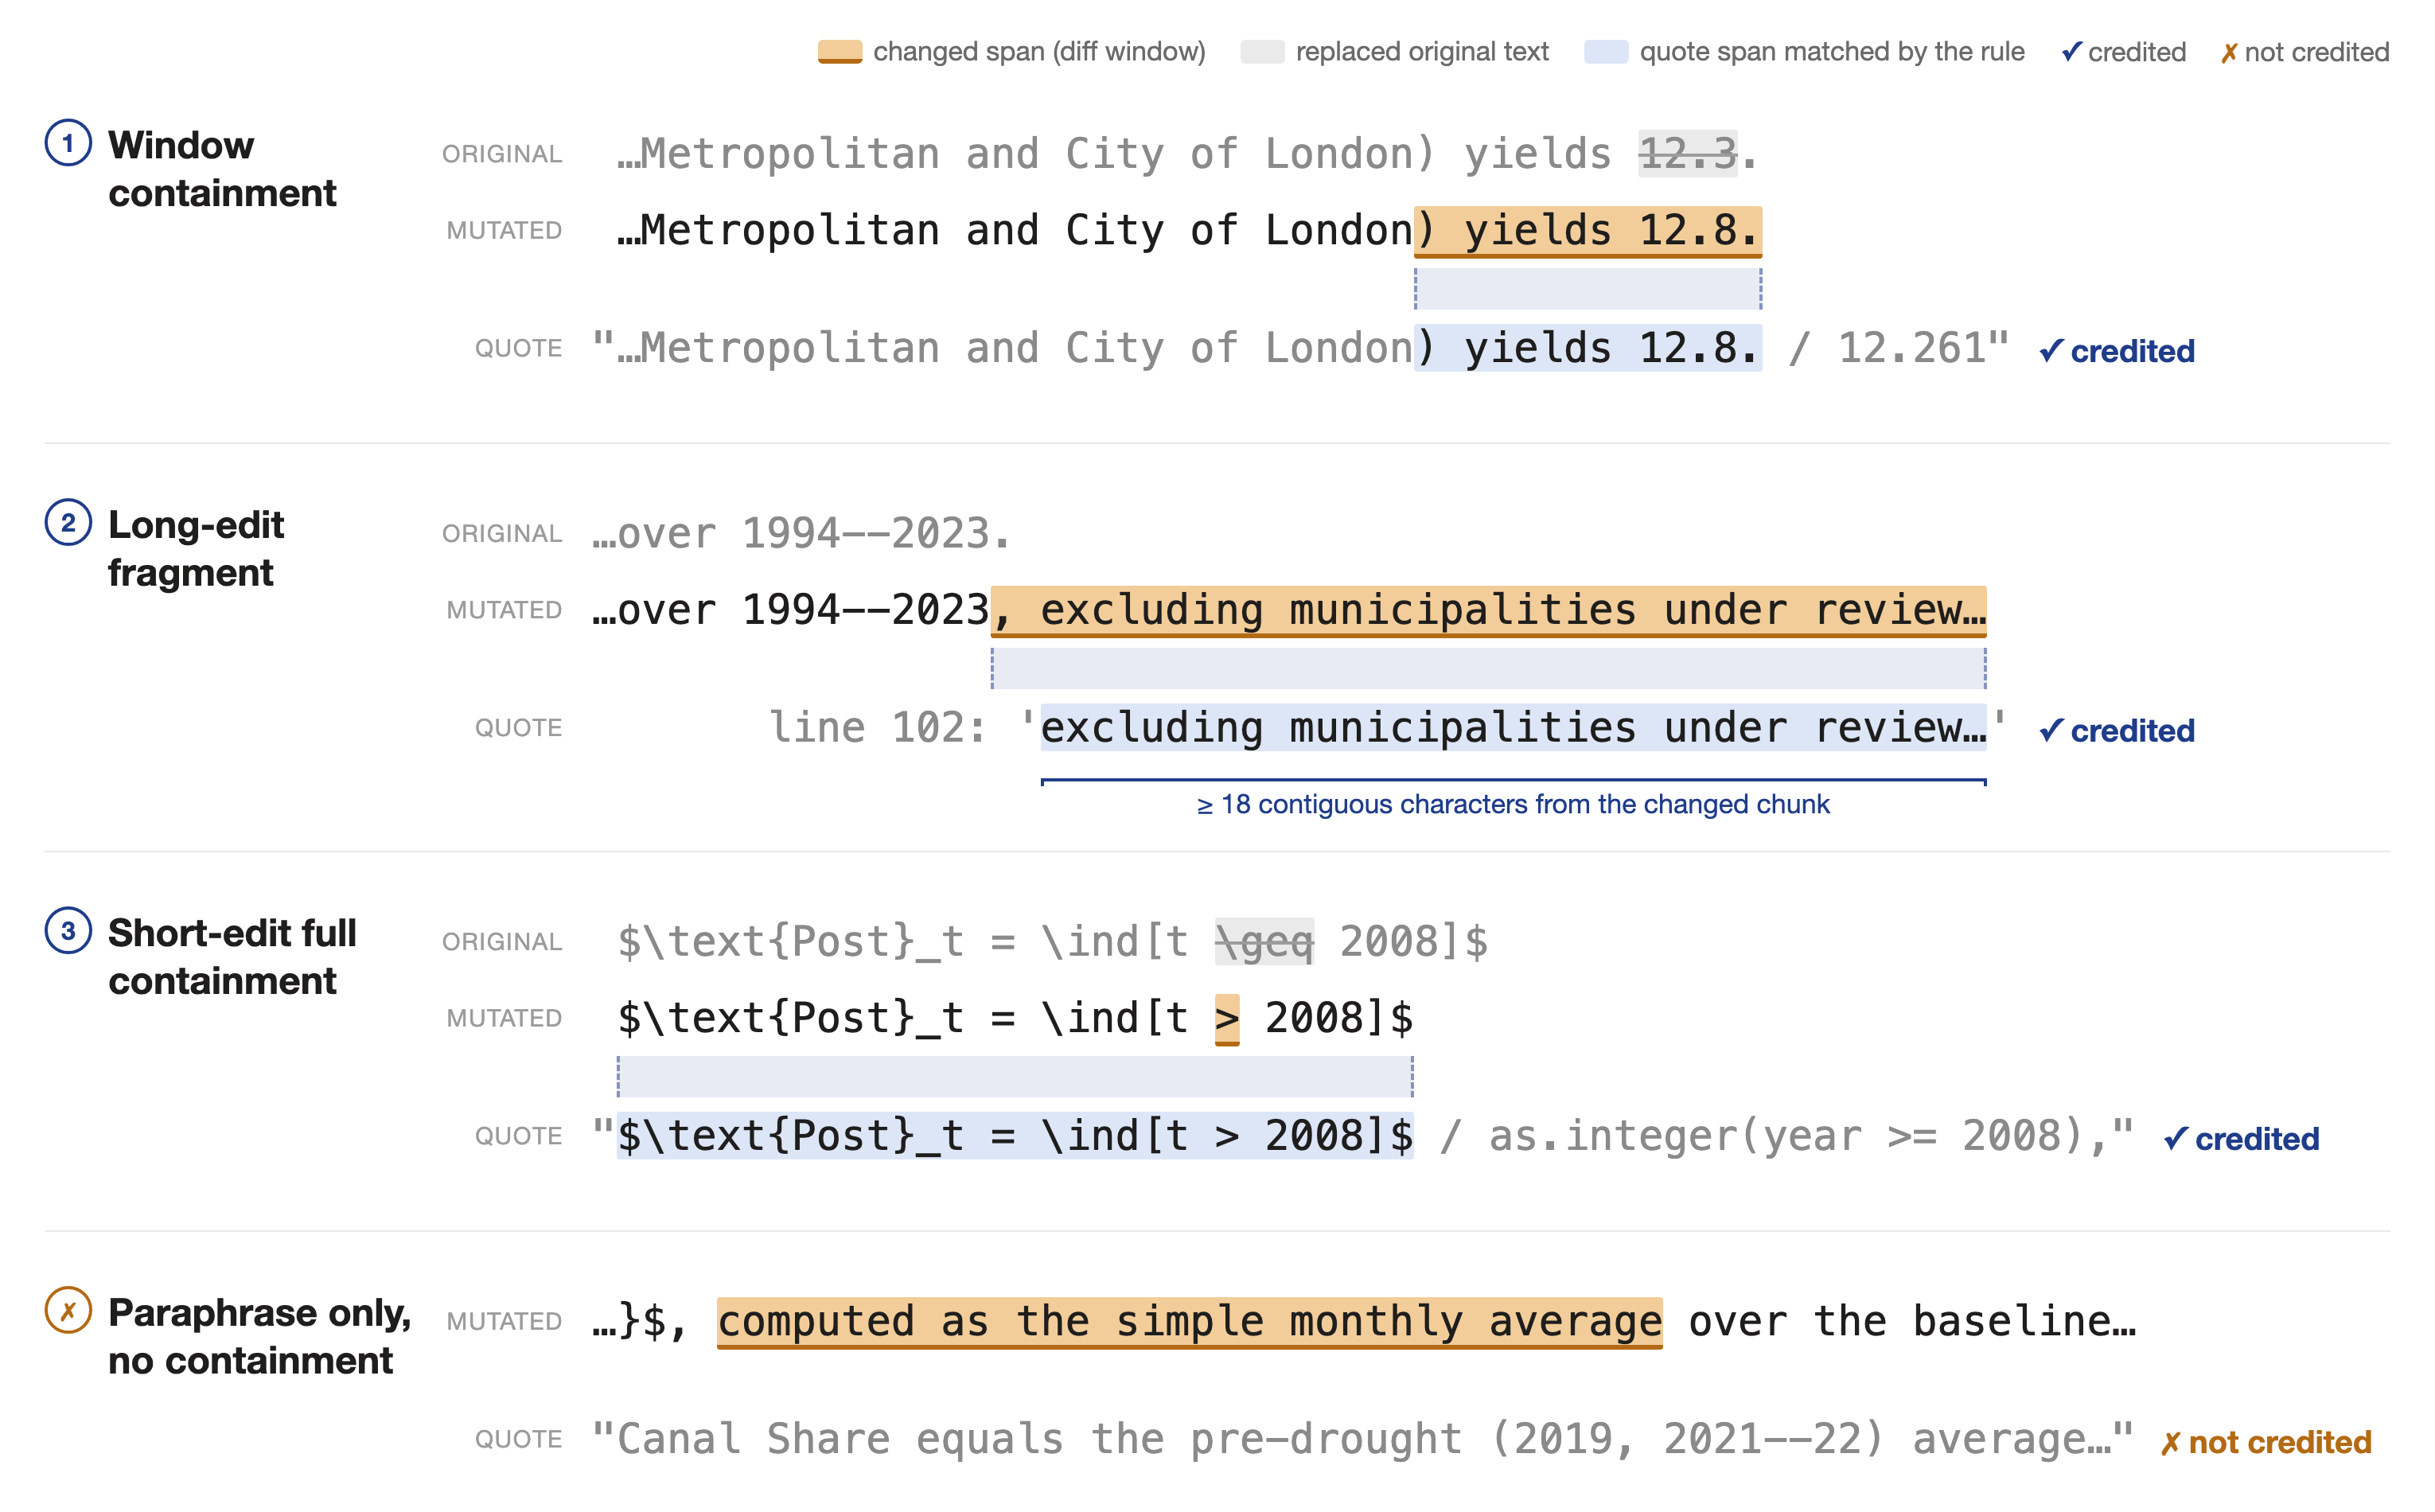
Figure 3: Each row aligns one injected edit (original versus mutated text, with the changed span highlighted) against the quoted evidence of one detector finding; the shaded band marks the quote span that satisfies the crediting rule. The bottom row shows a quote that paraphrases the injected error without containing any of the changed text, which receives no credit. All errors and quotes are real examples from the benchmark.
4 · Detection Capability: Recall vs. Cost
At the end of 2024, the best available model (o1) caught 30% of errors. By February 2026 the best model missed one in six, and in July 2026 we recorded the first model reaching 99% recall.
We measure recall by tasking the 80 configurations with identifying CRED errors in each of the 200 mutated copies of our 100 host papers. Single-shot and agentic configurations are tested slightly differently. Single-shot models are run using OpenRouter, a gateway to many labs' models, which charges per token. The same model is sometimes served by multiple providers at different prices, which is why we reconstruct costs based on the recorded token counts at each model's public list rate. Agentic configurations are run on our machines through the Claude Code or Codex Command Line Interfaces (CLI) using subscriptions that don't charge per token. Agentic results measure the model together with the harness version used at run time, and harnesses update over time, so an older model run through a later harness may do better than it would have at release. Every model was scored between June and July 2026. A model released in 2024 was therefore measured in 2026: its position on the release-date axis says when it became available, while the measurement itself is current.
Detection recall over time
The evolution of recall over time is shown in Figure 4. Models released by July 2024 cluster around 12–14%, but by January 2025, recall climbs to 30–40% with the introduction of the first two reasoning models, o1 and DeepSeek R1. Recall then continues rising, reaching 80% in February 2026, and less than six months later, 99% recall is achieved by Codex 5.6 Sol (high).
Single-error detection recall by model release date · v0.92
Capability sample · 80 configurations · pooled single-error recall (n=200)
Figure 4: Each point is one detector configuration's pooled single-error recall (n=200 injected errors, benchmark v0.92), plotted at the model's release date; all models are scored today. Configuration-specific 95% paper-clustered bootstrap intervals appear on hover. Triangles are agentic configurations, which use the harness version used at run time, not the harness available at the model's release. The navy line is the running best recall; labeled models set a new record.
The frontier, by model release date
The set of configurations at the frontier of cost-recall has also evolved over time. For each dated group, we plot the best available cost-recall trade-off by that date, keeping only undominated configurations (dominated grey points are models beaten on both price and recall). Since 2024, a time when the frontier was both weak and expensive, the frontier moved up and left, as recall increased and cost decreased for the same fixed recall.
Cost–recall frontier by model release date · v0.92
Capability sample · 80 configurations · recall vs. API-equivalent list-price cost
Figure 5: Each point is one detector configuration's pooled single-error recall (n=200 injected errors, benchmark v0.92) against API-equivalent list-price cost per paper, reconstructed from recorded token counts using prices as of 2026-07-14; all models are scored today and plotted at their release date. Configuration-specific 95% paper-clustered bootstrap intervals appear on hover. Circles are single-shot models; triangles are agentic configurations, which observe (model + harness) at the run date — all agentic points use the harness version used at run time, not the harness available at the model's release. Each curve is the cost–recall frontier restricted to models released by that date; grey points are dominated.
What fixed recall costs over time
Instead of measuring what the best model can achieve, what happens when we keep the recall level constant and ask what the cheapest way to reach it is? In Figure 6, we plot how a fixed amount of recall has changed in price over time. The cheapest price for 50% recall has fallen roughly 90× per year over the past year, while 20% recall fell over 400× in eight months. This measurement highlights how increasingly high recall is becoming dramatically cheaper.
Cheapest API-equivalent cost of fixed detection recall, by model release date · v0.92
Capability sample · record-low API-equivalent cost per paper for each recall level
Figure 6: Each point is the model that set a new record-low cost for reaching the stated recall level, plotted at its release date. Lines are OLS fits of log cost on release date; labels give the annualized decline for windows of nine months or more, and the observed factor over shorter windows. Costs are API-equivalent reconstructions using prices as of 2026-07-14, so the lines describe what each model costs to run today, not historical price paths. Agentic points use the harness version used at run time, not the harness available at the model's release. Levels shown: 20%, 50%, 80%, 90%, and 99%. The 99% level has a single record point (first reached July 2026), so no trend is fitted. Recall of 80% or better did not exist at any price before February 2026.
The hardest chapter
We find that recall is not uniform across different types of errors. Detection averages 99% on execution errors, but this is by design: every detector receives the reproduction diagnosis (the log of whether the code ran and the tables reproduced) as input, and the execution result is written in it. To detect an execution error, a model only has to read it. Data integrity stands at 79% and prose–table at 64%. Paper–code inconsistency, at 48%, is the hardest chapter: a paper–code contradiction is written nowhere in the package — it exists only between the manuscript and the code, and must be constructed by reading both.
Detection recall by error chapter · v0.92
Capability sample · 80 configurations · per-chapter recall
Figure 7: Each grey point is one detector configuration's pooled recall on that chapter's injected errors (PCI n=90, PTI n=50, DAT n=40, EXE n=20; arms A and B pooled); the navy diamond is the mean across configurations. EXE recall averages 99.4% because the execution result is part of every detector's input.
The average PCI error is caught by 48% of the configurations, and the residual misses of the strongest configurations are concentrated in the consistency chapters — both errors the 99% run left uncredited are consistency errors.
The same pattern holds error by error. We can group the injected errors by what we know about them: chapter, severity annotation assigned during benchmark construction, and which file the edit modified. We can then ask which kinds of error the detectors miss most often. For example, an error planted in the analysis code is caught by 81% of configurations on average, while an error planted in the manuscript is caught by 54%.
What kind of error gets missed · v0.92
Capability sample · 80 configurations · mean detection share by defect attribute
Figure 8: The unit of observation is an injected error (n=200); its detection share is the fraction of the 80 configurations that localize it. Rows are stratum means. Edit surface refers to the file the mutation modified: the manuscript (paper-side), the analysis code (code-side), or a rendered table (table-side). Severity was assigned during benchmark construction, not by the detector. The comparison is descriptive: severity is associated with CRED chapter, and the minor group is small.
Detection without attribution
We also study whether our detector assigns errors to the right CRED chapter. For example, if it really is a prose–table inconsistency (PTI) and not a paper–code inconsistency (PCI), does the detector assign it correctly? Our results show that it does a good job of this: among credited findings, it names the correct chapter 93% of the time (pooled across configurations). To see this, consider the confusion matrix below. Here, we compare the detector's attribution against our ground truth. Most of the misattribution sits in a single cell of the confusion matrix: 18% of credited PCI findings are emitted as PTI, which accounts for 83% of all misattribution in the pool. We speculate that this misattribution likely occurs because the detector has to perform an extra step. That is, it may quote the right line but name the wrong mechanism, recording the discrepancy without registering that establishing it required reading the code.
Chapter attribution of credited findings · v0.92
Capability sample · 80 configurations · benchmark vs. emitted chapter
Figure 9: The unit of observation is a credited finding on the single-error pool (10,118 findings pooled over 80 configurations); cells are row-normalized shares, and the diagonal is the chapter-correct share.
Detection without attribution, worked (benchmark chapter: PCI, apep_1239). The injected edit narrows the paper's post-treatment window. A detector returns:
{quote: "Post_t = 1[t > 2008]", location: "paper.tex:3.2", primary_code: "PTI", confidence: 71}
The quote verbatim contains the mutated span, so it ties the injected defect — detection credit. But the benchmark chapter is PCI: the contradiction is only established by reading the code, which still counts 2008 as post-treatment. The detector emitted PTI, so the finding earns detection but not chapter-correct credit. 18% of credited PCI findings fail exactly this way.
How can we pay our way to better verifiers?
Test-time compute
Increasing test-time compute, often called “reasoning effort,” is a well-known way to improve the capabilities of language models. We first show how recall improves for a set of commonly used closed-weight models as we increase compute within each model.
Within a model family, the reasoning-effort setting acts as a price dial, as higher reasoning typically equates higher token usage. Codex 5.5 climbs from 88.5% to 96.5% recall across its effort ladder for 1.9 times the cost, Sonnet 4.6 climbs from 72% to 83.5% for 2.6 times the cost, and Codex 5.6 Sol climbs from 94.5% to 99% for 2.0 times the cost.
The effort dial · v0.92
Capability sample · complete within-family effort ladders · recall vs. cost
Figure 10: Each polyline is one model family through its reasoning-effort settings; points are pooled single-error recall (n=200) against API-equivalent cost per paper reconstructed from recorded token counts using public list prices as of 2026-07-14. Effort labels are ordinal within a family, not comparable across model families.
Ensembles
So-called “ensembles,” which orchestrate outputs from different models, are another well-known way to improve performance.1717. Ensemble selection from libraries of models: Caruana et al. (2004), ICML; Dietterich (2000) on ensemble methods. One reason ensembles may be efficient is that different models introduce diversity: they miss different types of errors in papers.1818. Diversity, not redundancy, is what makes classifier ensembles work: Margineantu & Dietterich (1997), ICML; Kuncheva & Whitaker (2003), Machine Learning. Below, we investigate the cost-effectiveness of open-weight models as inputs to an ensemble search. We find that this approach can be quite cost-effective.
We combine configurations with an OR rule: an ensemble detects a defect if any member's credited finding does. We select members using a cost-aware variant of forward selection, adding at each step the configuration with the largest recall gain per additional dollar. To reduce tailoring to our particular 200 errors, we repeat the selection on 50 random subsets of the detector library, combine the selections by vote, and evaluate recall on a held-out 30% of the errors, averaged over five splits. Reported ensemble recall is therefore out of sample.1919. Within each split, errors from the same paper remain together.
With four members, the ensemble library reaches 99.3% recall at about $0.07 per paper. With 15 members, held-out recall reaches 100% at $0.44. The gain comes from diversity rather than redundancy: members miss different errors. The caveat is precision. An OR rule multiplies findings, and we do not measure the validity of the combined set of findings.
The ensemble frontier · v0.92
Capability subset with ensemble inputs · 80 configurations · mean recall on papers held aside for evaluation
Figure 11: Each point is the best ensemble of k members found by cost-aware forward selection on the single-error pool, evaluated out of sample. Hovering a point shows the most frequent additions at that size.
The diversity is visible directly. Contrary to our expectation, correlations in the errors that pairs of detectors miss show little clustering by lab. Configurations from the same lab do not consistently miss the same errors.
Which detectors miss the same errors · v0.92
Capability sample · 80 configurations · grouped by lab, newest first
Figure 12: Each cell is the phi correlation2020. The phi coefficient is the correlation of two binary variables: here, for each pair of detectors, whether each missed a given error. A value of 1 means the two detectors miss exactly the same errors; 0 means their misses are unrelated. between two configurations' per-error miss indicators on the single-error pool (n=200 injected errors). Rows and columns are grouped by lab in the following order: Anthropic, OpenAI, Google, Meta, Kimi, DeepSeek, then the remaining labs alphabetically. Within each lab, configurations are ordered by model release date, from most recent to oldest.
5 · Additional Robustness Tests of Verifier Reliability
In the previous section, we show how LLMs are reaching near-perfect scores in error detection. These measurements were made in controlled settings. We only inject one error, run the detector once, and score against our own ground truth. Policy evaluation in practice is far messier, and papers contain an unknown number of errors. Automated verifiers may also struggle as errors compound and complexity increases, in the sense that the probability of catching one error could go down if there are other errors present. Since LLMs are stochastic, an automated verifier could report different errors across runs. Finally, a model's reported ‘confidence’ in error detection may be entirely spurious.
To assess robustness, we measure three more properties on the same instances: what happens when a paper contains a second error, whether per-error detection outcomes change between identical runs, and whether stated confidence predicts anything. Each one changes how the headline recall should be read.2121. We follow the framing of Rabanser et al. (2026), “Towards a Science of AI Agent Reliability”: capability and reliability are distinct axes, and reliability must be measured on its own. We show that reliability does not appear to order with capability or price: the current recall leader has AUROC 0.72, below the at-scale median of 0.74, on discrimination (how well its confidence separates findings that detect the injected error from those that do not) among detectors that emit findings at scale, and DeepSeek V4 Flash xhigh changes 15% of its per-error detection outcomes between two identical runs.
5.1 · Compounding errors
What happens to recall when we inject an additional error into the same paper? Adding a second error lowers per-defect recall for 17 of 18 configurations, with effects ranging from a 9.5-point drop to a 1.5-point gain (median drop of 4 points). Because the two-error arm reuses the identical errors, this suggests that any drop in recall is caused by the presence of the second error (the errors themselves are unchanged). The two-error arm covers the 18 configurations in the interference panel; the newest models have so far run the single-error arms only. Seven configuration-specific 95% intervals exclude zero.
Single-error versus two-error recall · v0.92
Interference panel · 18 configurations · the same errors alone and paired
Figure 13: Each row is one configuration's recall on the same 200 injected errors alone (open circle) and with a second error present in the paper (filled square); the horizontal gap is the interference. Amber connectors mark drops.
The mechanism is visible in output volume: the number of findings a configuration emits per paper stays essentially flat when the injected defects double, so the same number of findings has to cover more errors. The drop concentrates in the consistency chapters (PCI and PTI), while DAT and EXE are stable under load, and its size is unrelated to single-error recall: configurations with similar recall differ widely in how much a second error hurts them. Robustness therefore has to be measured separately.2222. The pattern echoes multi-target retrieval stress tests (Hsieh et al. 2024, RULER, COLM) and position effects (Liu et al. 2024, “Lost in the Middle,” TACL) — but appears here at ordinary context lengths.
This finding, that verifiers are less likely to detect a given error or defect if there are additional errors or defects, suggests that there is a potentially important interplay between automated generation of policy evaluation and automated verification of it. If the generator is worse, producing more errors, then the verifier will perform worse too. It is beyond the scope of the current research to study the functional form, but we will investigate this hypothesis in follow-up research in Project APE.
5.2 · Consistency: run-to-run variance
We run 10 configurations a second time — the subset with replicate runs, spanning the frontier — on the same 100 errors from arm A with unchanged settings; since scoring is deterministic, any disagreement measures variability across runs for the full detector configuration. Aggregate recall is highly stable: it differs by 0 to 4 percentage points between runs. Codex 5.5 high is nearly deterministic at the individual outcome level and changes 1% of outcomes. For mid-ranked models, individual outcomes are much less stable: up to 28% of errors are detected in one run and missed in the other. Because the flips roughly cancel out, aggregate recall looks stable even when many individual outcomes changed.2323. Unlike repetition metrics such as pass@k (Yao et al. 2024, τ-bench), both runs are scored against known injected defects, so agreement is measured on ground truth rather than on self-consistency.
Recall agreement between two identical runs · v0.92
Repeatability panel · 10 configurations · two independent arm-A runs
Figure 14: Each circle is one configuration's recall on the same 100 injected errors, run twice with unchanged settings; the dashed diagonal is perfect agreement. Labels report the per-error flip rate: the share of errors detected in exactly one of the two runs. Offsetting flips leave aggregate recall unchanged, so a point can sit on the diagonal at a non-zero flip rate.
5.3 · Predictability: confidence calibration
We measure two aspects of stated confidence: calibration (does stated confidence match how often a finding detects the injected error?) and discrimination (does confidence rank findings that detect the injected error above those that do not?). Consider one comparison. Among findings above 90% confidence, 16% of Codex 5.6 Sol high's findings detect the injected error, compared with 84% of Opus 4.8's. The same confidence score therefore has different meanings across models. For every configuration that emits findings at scale, the share detecting the injected error falls short of stated confidence across the whole scale.2424. Overconfidence in verbalized confidence is a general LLM finding: Kadavath et al. (2022); Tian et al. (2023, EMNLP); Xiong et al. (2024, ICLR).
Stated confidence versus observed detection · v0.92
Capability subset with finding-level confidence · 80 configurations · share of findings detecting the injected error
Figure 15: Each finding carries a numeric 0–100 confidence, grouped into equal-width bins; the curve plots each bin's mean stated confidence against the share of its findings that detect the injected error. Curves below the dashed diagonal have confidence above the observed share; marker size is bin count. Four recent configurations that emit findings at scale are drawn in color to span a broad range of calibration behavior; the rest of the 80 eligible configurations are in grey. The figure counts only findings that detect the injected error; other findings can still identify valid defects. The gap from the diagonal is therefore not a general measure of finding validity.
Discrimination is heterogeneous. Among the 75 configurations that emit at least 150 findings, confidence ranks findings that detect the injected error above those that do not better than chance in 74 cases. AUROC ranges from 0.43 to 0.85, where AUROC is the probability that a finding detecting the injected error gets higher confidence than one that does not; 0.5 is chance and 1 is perfect. Confidence can therefore support triage for many configurations, but it is not universally informative and should not be read as a probability. Detection recall predicts neither calibration nor discrimination: the configuration with 99% recall has an AUROC of 0.72, while the best discriminator (Fable 5 med, 0.85) has detection recall of 96.0%. Among the configurations with list-order data, the detector's own list order serves the same purpose: 58 to 85% of credited findings appear first in the list. Calibration, discrimination, and list order move independently of recall and of each other, which is why we report them separately. None of them, however, answers the remaining question: whether the findings a detector reports are true. That is the subject of the next section.
6 · Precision and Finding Validity
The two previous sections measured what errors the verifiers missed. In this section, we investigate how many of their findings are real. To assess the verifiers' trustworthiness, recall alone is insufficient: a configuration can report every claim in a paper as an error and achieve perfect recall, all while being useless to the user. Rahman's motivating example makes the corresponding problem concrete: rewarding a monitor for reporting a mismatch can induce the monitor to report a mismatch without performing the costly check. Our precision exercise tests the analogous failure mode by examining whether the verifier's findings on unmutated papers are actually valid. Because we do not have a complete inventory of all defects in these unmutated papers, undetected defects cannot be observed. We therefore use the share of emitted findings that reviewers classify as valid defects as our measure of precision. Findings whose validity cannot be determined count as not valid, so the reported share is conservative.2525. Rahman (2012) motivates the monitoring problem described here. The design (two reviewers, disagreements resolved by consensus) follows the STARD reporting standard for diagnostic accuracy studies (Bossuyt et al. 2015, BMJ). At scale, this metric matters because even a modest share that is not valid can create substantial human review work.
We run the configuration selected for the precision exercise, Codex 5.5 high, which was the recall leader when selected, on a separate sample of 100 unmutated papers. The sample is disjoint from the recall hosts. Using a fixed seed, we selected papers at random within method strata from 779 eligible papers in the APE corpus of 1,000 papers, with the method mix chosen to mirror the recall hosts. Eligibility required a manuscript and a code directory, excluded packages containing Python, and did not depend on RBD results.
| Method | Papers |
|---|---|
| Difference in differences | 68 |
| Regression discontinuity | 15 |
| Event study | 10 |
| Bunching | 3 |
| Unknown | 3 |
| Instrumental variables | 1 |
| Total | 100 |
The run produced 461 findings, each independently labeled by two human reviewers at the Social Catalyst Lab and ETH Zurich, with disagreements resolved by consensus. Of the 461 findings, 449 are valid defects, 6 fall outside scope, 4 are false alarms, and 2 are unclear. A valid defect is supported by the package evidence and falls within the verification task; a finding outside scope identifies an issue outside that task; a false alarm is not supported by the evidence; and an unclear finding cannot be resolved from the available package. The observed share classified as valid defects is 97.4% (95% Wilson interval: 95.5–98.5%), and the share not classified as valid is 2.6%.
Reviewers agreed on 91.3% of findings before consensus. Consensus exceeded both individual reviewers because jointly inspected ‘unclear’ cases resolved to valid. Validity is high in most chapters: all 141 execution findings are valid, the two consistency chapters sit at 96–98%, and data integrity is lower: 11 of 14 findings are valid, but with so few findings the estimate is imprecise. High- and low-confidence findings are valid at nearly the same rate (97% and 98%), so a finding's stated confidence says essentially nothing about whether it is valid. This mirrors the calibration results above.
Two adjudication decisions from the precision evaluation
One valid defect and one false alarm from the 461 adjudicated findings
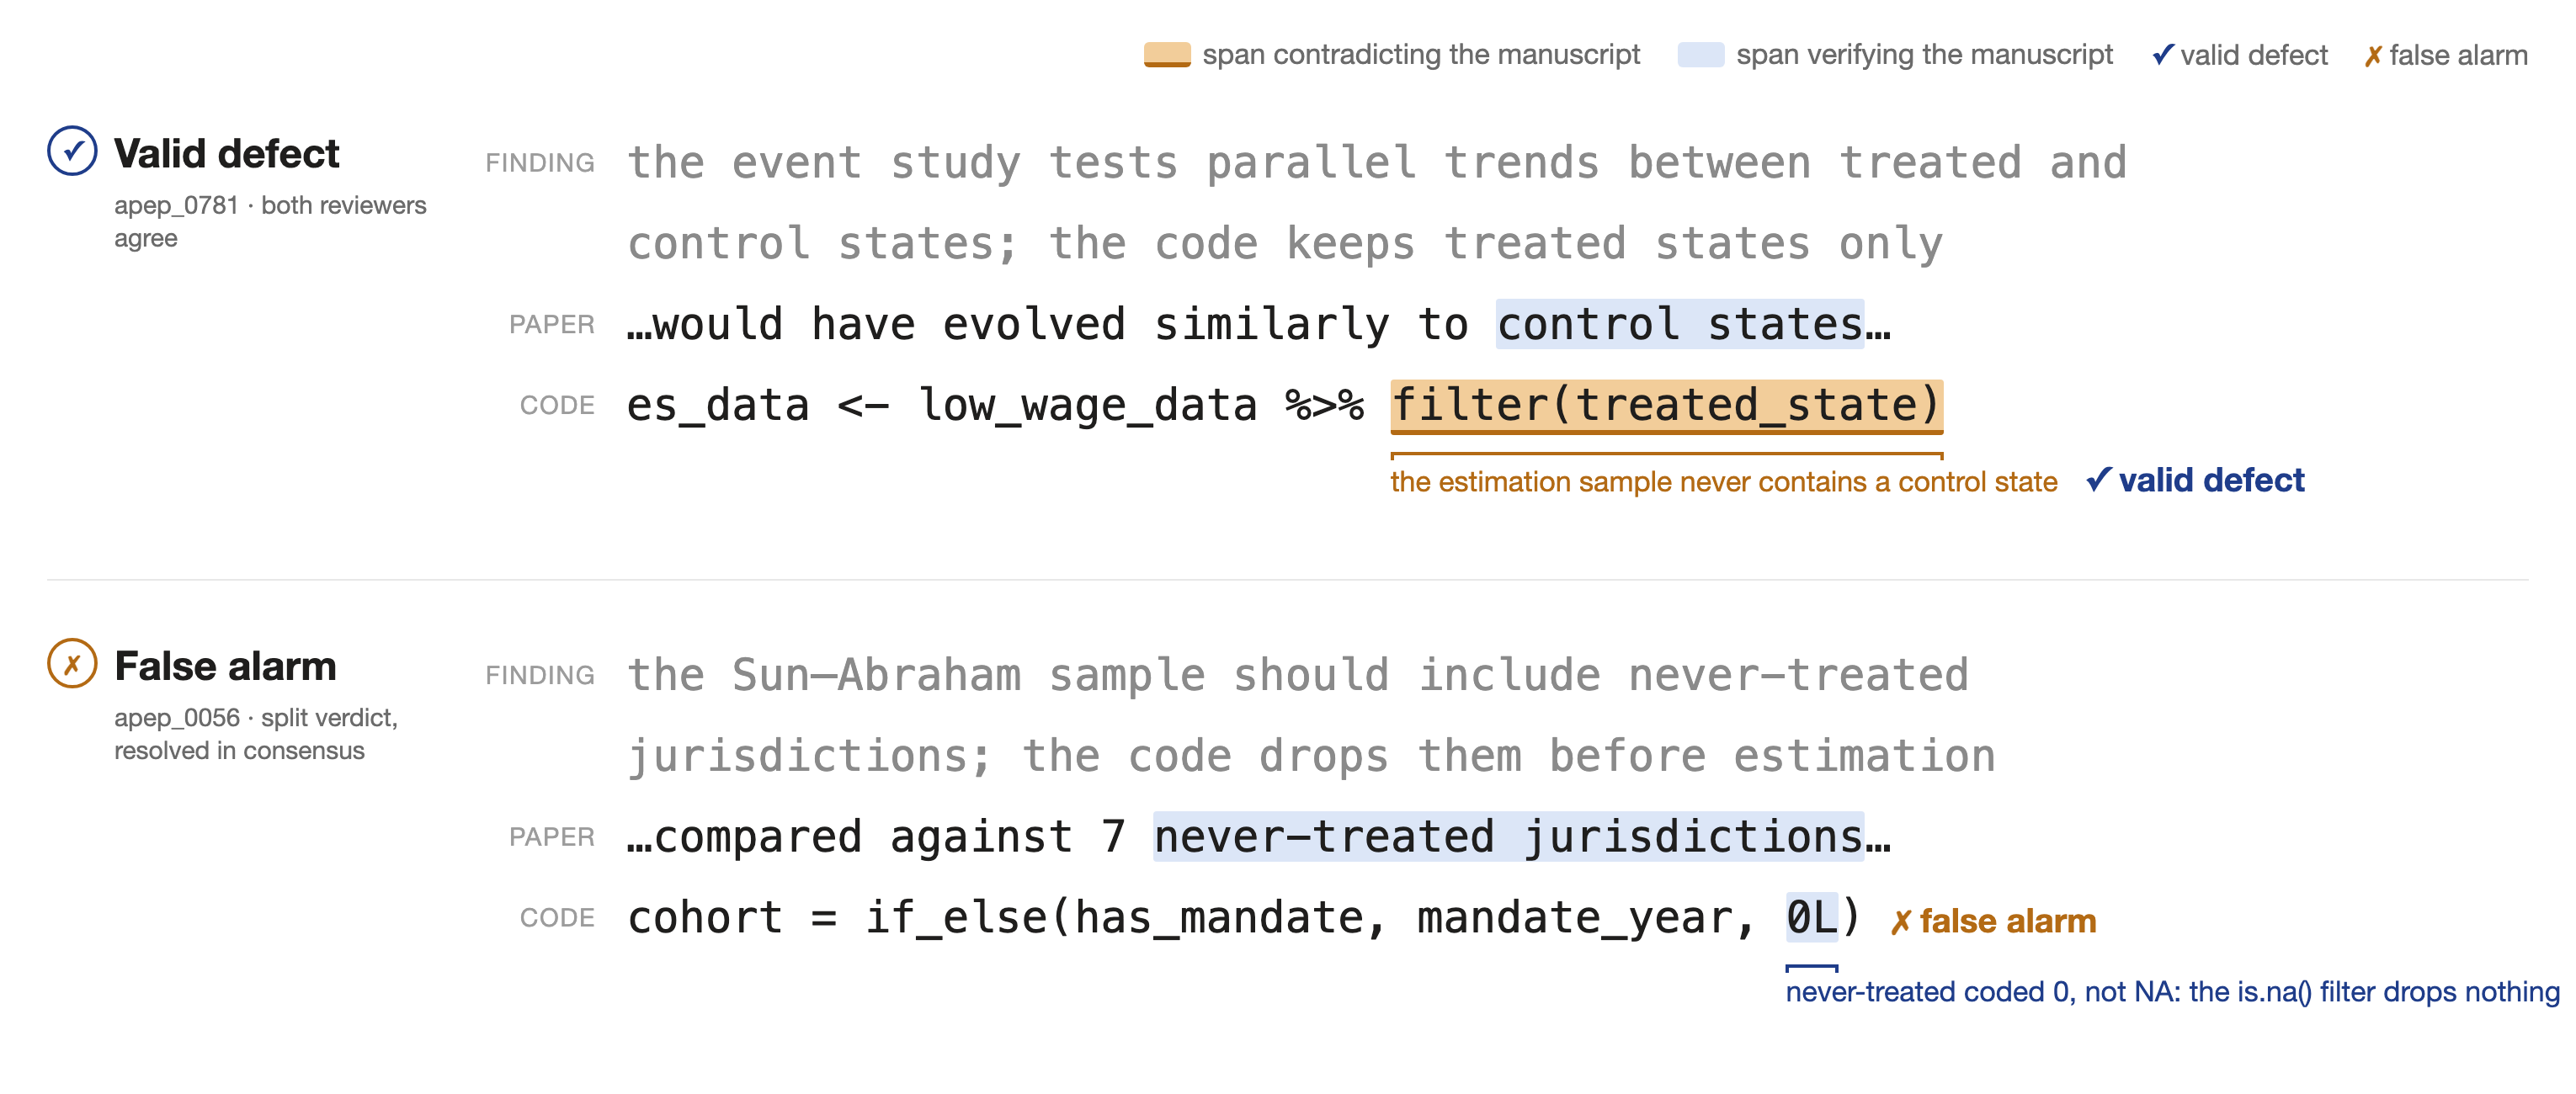
Figure 16: Each row aligns one finding of the Codex 5.5 (high) configuration on an unmutated paper against the decisive manuscript and code evidence; highlighted spans mark the passages the reviewers verified, and the classification is the consensus of two independent reviewers.
To shed light on the basic economics of verification, we log human reviewers' time use, apply simple labor-cost accounting, and compare it with automated verification through back-of-the-envelope calculations. Dual human review runs at 5.2 minutes per finding, roughly 24 minutes per adjudicated paper. For an hourly human labor cost of $100 per hour, this corresponds to about $40 of expert time per paper. This can be benchmarked against $0.82 for the machine scan it audits ($0.007 at the cheap end of the frontier). These numbers price one specific task: an expert checking the machine's findings. They say nothing about the cost of verifying a paper from scratch, which takes hours. Adjudication time also tracks the difficulty ordering of the recall benchmark: execution findings take 6 to 12 seconds to confirm, while consistency findings take two to three minutes.
The precision estimate also helps interpret the findings on mutated papers that do not match the injected error. We did not adjudicate these, but the same configuration's findings on unmutated papers are 97% valid, so most of them are likely real defects of the host papers.
7 · Evaluation of the First 1,000 Papers
The automated corpus scans are now complete: we applied the selected CRED v0.92 verifier to all 1,000 APE papers and ran a matched comparison with a second verifier. Analysis and report writing are in progress. The report will present the scan design, corpus findings, cross-verifier comparison, and interpretation. The second verifier completed 998 papers and reported no findings on 9 of them, so agreement across the two scans was high but not complete.
The selected verifier reported at least one CRED-defined error or defect in every paper, often multiple, including findings it classified as severe. Based on that verifier's reports, we estimate that every single paper contains errors or defects as defined by Project APE's CRED taxonomy. These are verifier-reported findings, not individually human-adjudicated defects. The separate 100-paper human exercise above estimates the selected verifier's precision; it does not establish corpus-wide recall or validate the second verifier.
8 · Discussion and Way Forward
In this paper, we developed CRED, a versioned classification of research errors and defects, designed to verify the verifiers: to measure how reliable automated, LLM-powered verification systems actually are. Using injected errors for which we know the ground truth, we find that publicly available off-the-shelf verifiers reach 99% detection recall. Closed-weight models lead, strictly speaking, but open-weight models have essentially caught up. We also show that ensembles of multiple inexpensive open-weight models are highly cost-effective. While we focus on recall, the most important dimension of reliability, it is not the whole story: reliability spans several properties that move independently — attribution, consistency across runs, calibration of confidence — and calibration in particular remains unsolved. We also show that when a paper contains more than one error, detection recall degrades. If autonomously generated papers produce many errors, we would therefore expect one-shot verifiers to struggle. In that case it may be necessary to iterate between verification and generation, reducing errors round by round until they have been eliminated. We aim to explore that in future research.2626. It is worth noting that even if end-to-end autonomous policy evaluation is not the goal, or is viewed as currently unreliable, quantifying the reliability of the verifier helps with human-in-the-loop triage. On algorithmic triage and learning to defer to an expert: Raghu et al. (2019); Mozannar & Sontag (2020), ICML. Agarwal, Moehring & Wolitzky (2025) derive a sufficient statistic for deciding which decisions to automate and which to hand to a human.
We argue for the ideal that anything that can be verified should be verified. In practice, it is not obvious what that entails, and it raises a deeper question: where is the boundary between what is verifiable and what is not? At its core, a policy evaluation follows a particular formula. There is a policy of interest (a minimum wage increase in Pennsylvania) and one or more outcomes (employment). There is an estimand — the object of interest, such as the average effect of the increase on employment among fast-food workers. And there is an estimator applied to data, producing an estimate. What here is verifiable? The estimand is not, because it is a definition, not a claim — it is stated by the researcher, the policymaker, or an autonomous agent. There is nothing to check. The estimator rests on assumptions about the underlying data-generating process. For example, a difference-in-differences regression assumes parallel trends. This is a counterfactual assumption that cannot be verified, again by definition. Just as omitted variables are unobservable, so is the true error structure. For example, whether the DGP has homoskedastic errors is not a verifiable fact, even if, under additional assumptions, statistical tests can probe it. In each case, the boundary between what is fundamentally observable and unobservable determines what can be verified. But below that boundary lies a large and crucial territory of fact: the end-to-end execution of the research, from data fetching to estimation to the generation of tables to the prose that describes the process, its choices, and its output. In that territory, errors have a ground truth, and we argue that a reliable verifier should always detect them.
CRED is a first attempt at putting structure on that territory. Its four chapters sit entirely on the verifiable side of the boundary: whether the data match their claimed source, whether the code runs and reproduces its own output, whether the prose matches the code, and whether the prose matches the tables. Together with human adjudication, it allows us to quantify how reliable verifiers are. We claim neither that this classification is exhaustive nor that the errors we inject are representative of the errors AI-generated research will actually produce, now or in the future. Indeed, the reason we version the classification is that we expect it to evolve. It can expand vertically, into more refined sub-chapters, and horizontally, into new chapters. Moreover, we aim to explore in future research harder, more complex errors within existing chapters.
The value of a good verification system goes well beyond checking a single paper. One can improve the very harness that generated the research in the first place. How to build better generation harnesses for policy evaluation is an open research question. How to close the loop — creating the environment for a self-improving harness that learns to generate few or no errors — is, we believe, the most promising avenue toward autonomous policy evaluation at scale.
Benchmark versions
v0.92 (current). 100 host papers that passed RBD, one or two injected errors per instance, deterministic matcher, numeric confidence. All results on this page are scored under v0.92. We anticipate the codebook to evolve over time to reflect a wider breadth of error types found in automated policy evaluation; when it does, results under the new version will appear here as a dated entry, older versions will remain addressable, and numbers will not be compared across versions. The admission rule is fixed: a class enters the codebook only if there is a deterministic rule for how the error shows up in the paper and its code. A larger codebook may lower measured recall. Comparisons should therefore be made within a fixed benchmark version.
Rolling updates. CRED is a living benchmark. We update this page on a rolling basis as new models, effort settings, and completed run designs become available. In the coming days and weeks, we will add newly released models and complete additional AB and replicate runs. New configurations generally enter the capability sample first; interference and repeatability results follow when the additional runs are complete. We aim to run arms A and B for every eligible new model. We prioritize AB and replicate runs for models that enter the cost-recall frontier, major new flagship models, and configurations needed to complete effort ladders. The export date at the top of the page identifies the current results status. Additions of models or runs retain the existing benchmark version; changes to the benchmark, scoring rules, or error corpus require a new version. We will update the human-adjudication exercise as detector selection changes. The automated 1,000-paper scans are complete; analysis and report writing are in progress.
References
Abadie, Alberto, Susan Athey, Guido W. Imbens, and Jeffrey M. Wooldridge (2020). Sampling-based versus design-based uncertainty in regression analysis. Econometrica 88(1), 265–296.
Agarwal, Nikhil, Alex Moehring, and Alexander Wolitzky (2025). Designing human-AI collaboration: A sufficient-statistic approach. NBER Working Paper 33949.
Baumgärtner, Tim, and Iryna Gurevych (2026). SciCoQA: Quality assurance for scientific paper–code alignment. arXiv:2601.12910.
Bavaresco, Anna, Raffaella Bernardi, Leonardo Bertolazzi, et al. (2024). LLMs instead of human judges? A large scale empirical study across 20 NLP evaluation tasks. arXiv:2406.18403.
Bianchi, Federico, Yongchan Kwon, Zachary Izzo, Linjun Zhang, and James Zou (2025). To err is human: Systematic quantification of errors in published AI papers via LLM analysis. arXiv:2512.05925.
Bossuyt, Patrick M., Johannes B. Reitsma, David E. Bruns, et al. (2015). STARD 2015: An updated list of essential items for reporting diagnostic accuracy studies. BMJ 351, h5527.
Caruana, R., A. Niculescu-Mizil, G. Crew, and A. Ksikes (2004). Ensemble selection from libraries of models. In Proceedings of ICML.
DeMillo, R. A., R. J. Lipton, and F. G. Sayward (1978). Hints on test data selection: Help for the practicing programmer. IEEE Computer 11(4), 34–41.
Dietterich, Thomas G. (2000). Ensemble methods in machine learning. In Multiple Classifier Systems, Lecture Notes in Computer Science 1857, 1–15.
Dycke, Nils, and Iryna Gurevych (2025). Automatic reviewers fail to detect faulty reasoning in research papers: A new counterfactual evaluation framework. arXiv:2508.21422.
Goodman, Steven N., Daniele Fanelli, and John P. A. Ioannidis (2016). What does research reproducibility mean? Science Translational Medicine 8(341), 341ps12.
Hsieh, C.-P., S. Sun, S. Kriman, S. Acharya, D. Rekesh, F. Jia, Y. Zhang, and B. Ginsburg (2024). RULER: What's the real context size of your long-context language models? In Proceedings of COLM.
Hu, Chuxuan, Liyun Zhang, Yeji Lim, Aum Wadhwani, Austin Peters, and Daniel Kang (2025). REPRO-Bench: Can agentic AI systems assess the reproducibility of social science research? In Findings of ACL 2025, 23616–23626.
Jacovi, Alon, Avi Caciularu, Omer Goldman, and Yoav Goldberg (2023). Stop uploading test data in plain text: Practical strategies for mitigating data contamination by evaluation benchmarks. In Proceedings of EMNLP, 5075–5084.
Jia, Y., and M. Harman (2011). An analysis and survey of the development of mutation testing. IEEE Transactions on Software Engineering 37(5).
Kadavath, S., T. Conerly, A. Askell, et al. (2022). Language models (mostly) know what they know. arXiv:2207.05221.
Kohler, Benjamin, David Zollikofer, Johanna Einsiedler, Alexander Hoyle, and Elliott Ash (2026). Read the paper, write the code: Agentic reproduction of social-science results. Working paper, ETH Zurich.
Kuncheva, Ludmila I., and Christopher J. Whitaker (2003). Measures of diversity in classifier ensembles and their relationship with the ensemble accuracy. Machine Learning 51(2), 181–207.
Liu, N. F., K. Lin, J. Hewitt, A. Paranjape, M. Bevilacqua, F. Petroni, and P. Liang (2024). Lost in the middle: How language models use long contexts. Transactions of the ACL 12, 157–173.
Lu, Chris, Cong Lu, Robert Tjarko Lange, Jakob Foerster, Jeff Clune, and David Ha (2024). The AI Scientist: Towards fully automated open-ended scientific discovery. arXiv:2408.06292.
Margineantu, Dragos D., and Thomas G. Dietterich (1997). Pruning adaptive boosting. In Proceedings of ICML.
Messing, Solomon (2026). Hidden measurement error in LLM pipelines distorts annotation, evaluation, and benchmarking. arXiv:2604.11581.
Mozannar, Hussein, and David Sontag (2020). Consistent estimators for learning to defer to an expert. In Proceedings of ICML, 7076–7087.
National Academies of Sciences, Engineering, and Medicine (2019). Reproducibility and Replicability in Science. Washington, DC: The National Academies Press.
Panickssery, Arjun, Samuel R. Bowman, and Shi Feng (2024). LLM evaluators recognize and favor their own generations. In Proceedings of NeurIPS.
Rabanser, S., S. Kapoor, P. Kirgis, K. Liu, S. Utpala, and A. Narayanan (2026). Towards a science of AI agent reliability. arXiv:2602.16666.
Raghu, Maithra, Katy Blumer, Greg Corrado, Jon Kleinberg, Ziad Obermeyer, and Sendhil Mullainathan (2019). The algorithmic automation problem: Prediction, triage, and human effort. arXiv:1903.12220.
Rahman, David (2012). But who will monitor the monitor? American Economic Review 102(6), 2767–2797.
Raji, Inioluwa Deborah, Emily M. Bender, Amandalynne Paullada, Emily Denton, and Alex Hanna (2021). AI and the everything in the whole wide world benchmark. In NeurIPS Datasets and Benchmarks Track.
Schmidgall, Samuel, Yusheng Su, Ze Wang, et al. (2025). Agent Laboratory: Using LLM agents as research assistants. arXiv:2501.04227.
Si, Chenglei, Diyi Yang, and Tatsunori Hashimoto (2024). Can LLMs generate novel research ideas? A large-scale human study with 100+ NLP researchers. arXiv:2409.04109.
Siegel, Zachary S., Sayash Kapoor, Nitya Nadgir, Benedikt Stroebl, and Arvind Narayanan (2024). CORE-Bench: Fostering the credibility of published research through a computational reproducibility agent benchmark. arXiv:2409.11363.
Son, Guijin, Jiwoo Hong, Honglu Fan, et al. (2025). When AI co-scientists fail: SPOT, a benchmark for automated verification of scientific research. arXiv:2505.11855.
Tian, K., E. Mitchell, A. Zhou, et al. (2023). Just ask for calibration. In Proceedings of EMNLP.
Wang, Peiyi, Lei Li, Liang Chen, et al. (2023). Large language models are not fair evaluators. arXiv:2305.17926.
Xi, Sarina, Vishisht Rao, Justin Payan, and Nihar B. Shah (2025). FLAWS: A benchmark for error identification and localization in scientific papers. arXiv:2511.21843.
Xiong, M., Z. Hu, X. Lu, et al. (2024). Can LLMs express their uncertainty? In Proceedings of ICLR.
Yao, S., N. Shinn, P. Razavi, and K. Narasimhan (2024). τ-bench: A benchmark for tool-agent-user interaction in real-world domains. arXiv:2406.12045.
Zheng, L., W.-L. Chiang, Y. Sheng, et al. (2023). Judging LLM-as-a-judge with MT-Bench and Chatbot Arena. In Proceedings of NeurIPS Datasets & Benchmarks.
Appendices
A · The CRED v0.92 codebook
CRED classifies defects according to the evidence visible in a replication package. It does not classify authorial intent or infer the underlying cause. Version 0.92 contains four chapters:
- Prose–Table Inconsistency (PTI). A value or claim in the manuscript disagrees with the corresponding cell in the tables, such as a numeric mismatch, a sign or significance flip, or a unit disagreement.
- Paper–Code Inconsistency (PCI). The manuscript disagrees with what the code does, such as a different estimation choice or an inaccurately stated sample, treatment timing, or variable construction.
- Execution/Reproducibility (EXE). The package does not reproduce itself, the code fails to run from beginning to end, or a rendered table cannot be regenerated from the current code.
- Data Integrity (DAT). The inputs are synthetic, fabricated, or transformed using outcome values.
When evidence could support more than one chapter, we assign the first applicable code in this order: EXE, DAT, and then PTI or PCI. PTI applies when the disagreement is visible from the manuscript and tables alone; PCI applies when identifying it requires reading the code. Severity is a separate reviewed annotation of the injected error, rather than a CRED chapter or independently validated ground truth.
B · Mutation protocol and the RBD reproducibility gate
Before mutation, each host must pass two checks: its code must run from beginning to end, and its regenerated tables must agree with the published tables within rounding. Of the 1,000 papers, 144 pass these checks. We selected 100 for feasibility and to obtain the planned mix of CRED chapters.
We designed and reviewed each mutation individually before applying it to a host. Because we control the original package and the exact edit, we know the injected error and its location. The mutated packages were not public before evaluation. Prior exposure to an unmutated host would therefore not reveal the change that a detector needed to identify.
Arm A contains one error per host: PCI 45, PTI 25, DAT 20, and EXE 10. Arm B contains one different error per host, with the same chapter totals assigned using a fixed permutation. Arm AB combines each host's exact A and B errors in one package. Across arms A and B, the severity mix is 136 moderate, 58 severe, and 6 minor. Severity is a reviewed benchmark annotation: severe denotes an error that could invalidate a headline result, moderate a material but contained error, and minor a localized issue unlikely to change substantive interpretation. Configurations completing all three arms see 300 instances; the capability sample requires the 200 A/B instances. The host paper is the clustering unit for all pooled inference.
C · Detector prompt, schema, and configurations
Every configuration received the same CRED v0.92 codebook, core task instruction, and output requirements. The core task instruction was:
Review this paper package against the CRED v0.92 taxonomy and report every
defect you can identify with confidence. Quote verbatim from the files.
Return a single JSON object matching the output schema.
The required output fields were:
{
  "findings": [{
    "primary_code": "PTI | PCI | EXE | DAT",
    "secondary_codes": ["optional additional codes"],
    "cred_codes": ["primary and secondary codes"],
    "confidence": "integer from 0 to 100",
    "rationale": "one sentence",
    "quote": "verbatim evidence",
    "location": "file and location",
    "severity": "severe | moderate | minor"
  }],
  "coverage_confidence": "integer from 0 to 100"
}
The severity field contains the detector's proposed severity. It is distinct from the reviewed benchmark severity annotation used to describe the injected errors. The coverage_confidence field was collected but is not used in the analyses reported here. Agentic harnesses enforced the JSON Schema; single-shot responses were parsed against the same fields. The two systems differed in delivery: one API call with the package concatenated, or a read-only workspace with shell tools. Each configuration received the manuscript, rendered tables, R code files, bibliography, and RBD diagnosis. Median input size was about 26,000 tokens.
The configuration metadata report the harness and exact harness version used for each agentic run. The recorded Claude Code versions range from 2.1.107 to 2.1.215, and the recorded Codex CLI versions range from 0.142.5 to 0.144.4. Every configuration's API-equivalent cost is reconstructed from recorded token counts at public list rates as of 2026-07-14, distinguishing cached, input, and output tokens. For single-shot configurations this closely tracks the metered API charge; agentic configurations were run through subscriptions, so their plotted cost is a list-price equivalent rather than cash expenditure.
D · Matching findings to injected errors
We score findings using fixed string-matching rules. Each finding includes a quote and a location. The matcher compares that quote with the text changed when we created the injected error. A finding receives detection credit only when its quote includes the changed segment itself. Quoting the right sentence, table, or code file without showing the change is insufficient.
Matching is performed on both raw and canonicalized text. Raw matching first requires the changed segment with 12 characters of context on each side and then tests the changed segment with a window of four characters of context on each side. Canonicalization removes LaTeX commands and whitespace and normalizes mathematical symbols and typography. It also permits one-sided windows when the available text contains enough numerical, mathematical, or code content to make the match distinctive.
We selected these thresholds while developing the matcher by reviewing cases in which it credited an unrelated finding or failed to credit a genuine detection. Once selected, the rules were fixed and applied uniformly to every injected error and detector configuration. They were not adjusted for individual models or results.
Two additional rules cover edits at either end of the length distribution:
- For a long insertion or replacement, the quote may contain only part of the changed passage. In that case, it must share a continuous sequence of at least 18 characters with the changed text itself.
- For an edit containing fewer than five content words or tokens, the quote must include the full original or mutated text verbatim.
Execution errors require one exception. For an EXE error, a finding may instead quote or cite the RBD result, because the failed execution recorded there is the observable evidence. This exception applies only when the injected error and the detector's finding are both labeled EXE.
On a two-error paper, we first calculate which findings qualify for which errors. We then choose a one-to-one assignment that detects the greatest number of errors. A finding cannot receive credit for both errors, and an error cannot be credited to two findings. Detection credit depends only on locating the changed content. Chapter-correct credit additionally requires the finding's chapter label to match the error's benchmark chapter.
For example, one mutation changes a file path to data/analysis_panel.rds. The quote saveRDS(panel, "data/analysis_panel.rds") receives credit because it contains the changed path. The statement “the pipeline writes the panel to the wrong path” does not: it may describe the problem correctly, but it contains none of the changed text.
These rules favor reproducibility and specific textual evidence over semantic interpretation. They can therefore miss findings that correctly identify an error but paraphrase the evidence. We interpret the resulting recall estimates conservatively.
E · Guardrail audit of agent transcripts
We retain the complete agent transcripts internally and use a deterministic scanner to audit their commands and file access. The transcripts are not released because they can reveal benchmark content. The audit tests whether agents attempted to leave their assigned workspace, access an unmutated paper, or use the network.
- 3,553 agentic runs.
- 22,639 executed commands.
- One external path read: a shared data-helper library containing no information about any paper or injected defect.
- Six network-pattern commands (0.03%): connectivity probes and package-installation attempts, none requesting paper content.
No command or read referenced the real repository's papers, the public mirror, or an unmutated original. Claude-family agents relied on instructions not to use the network, while the Codex sandbox blocked network access at the operating-system level.