 ↗ Enlarge figure
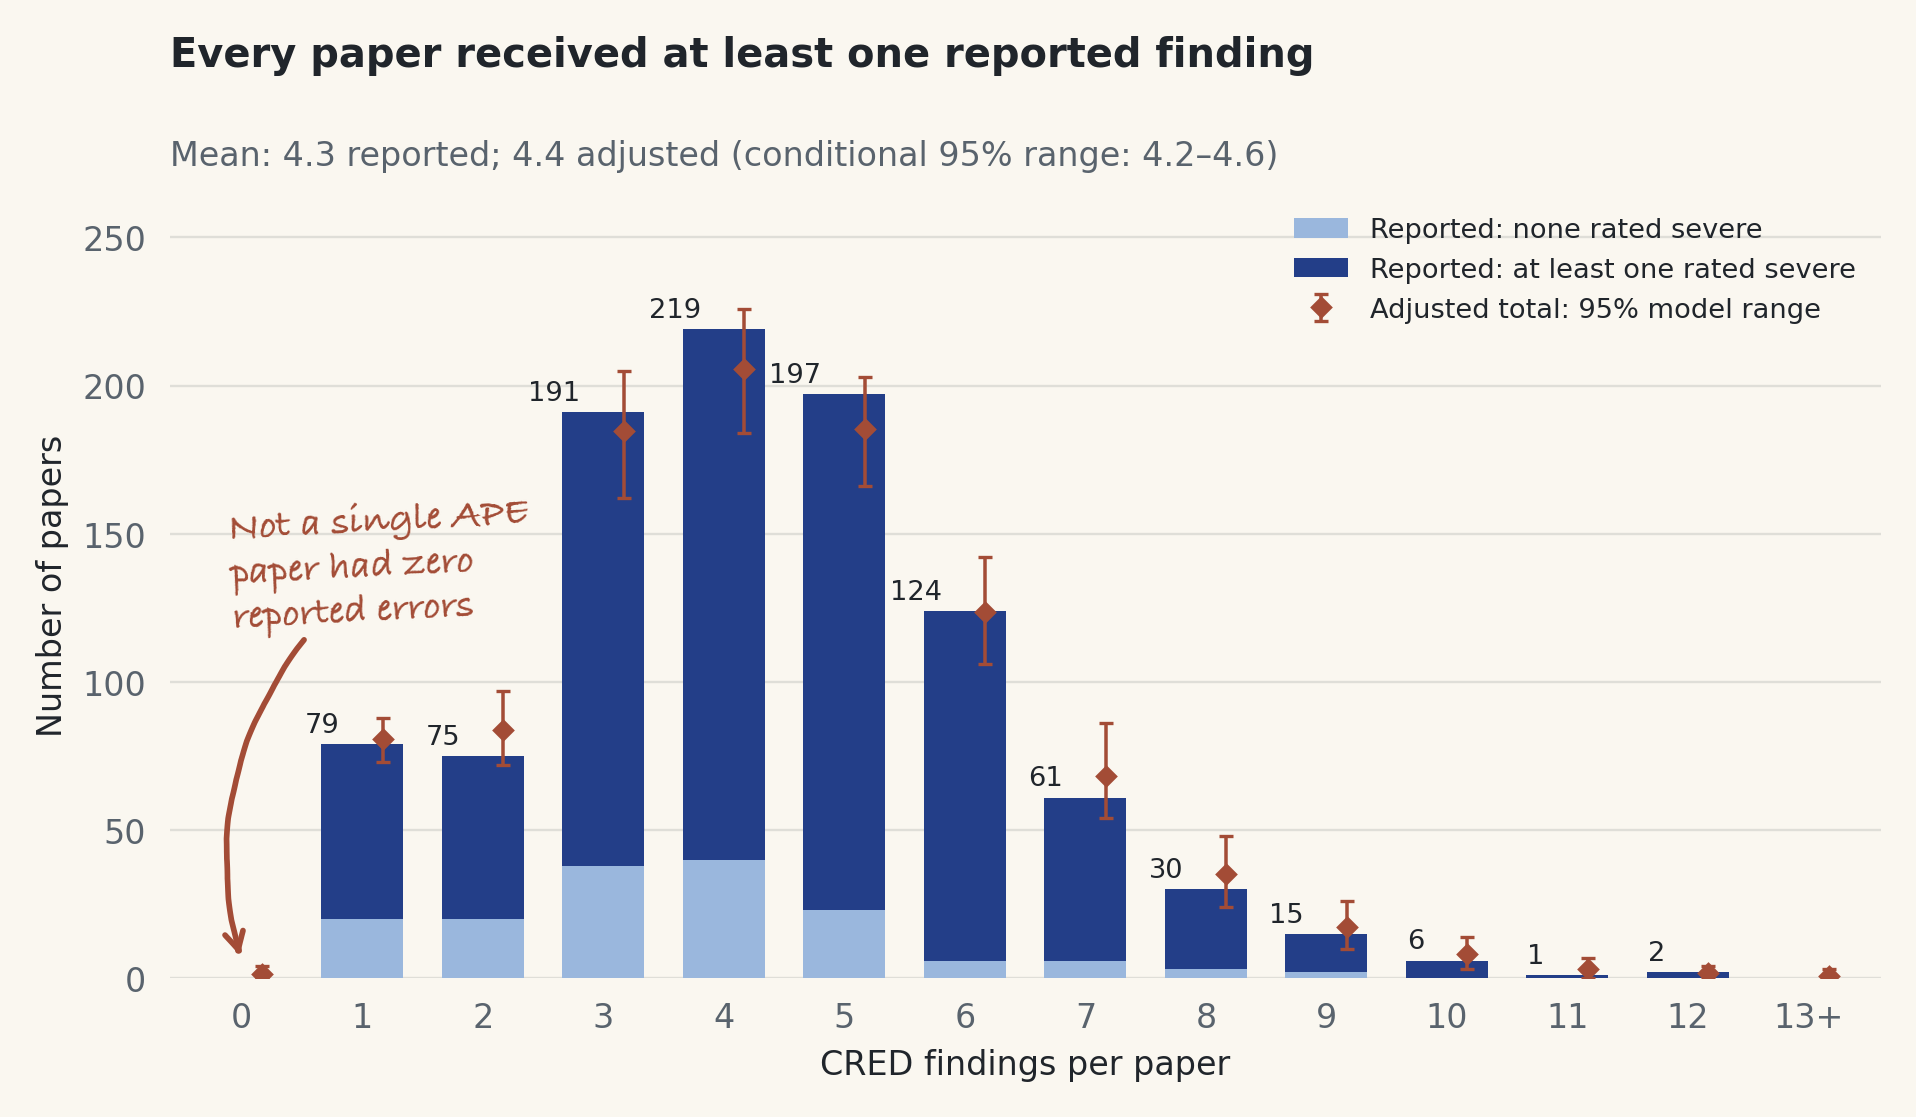
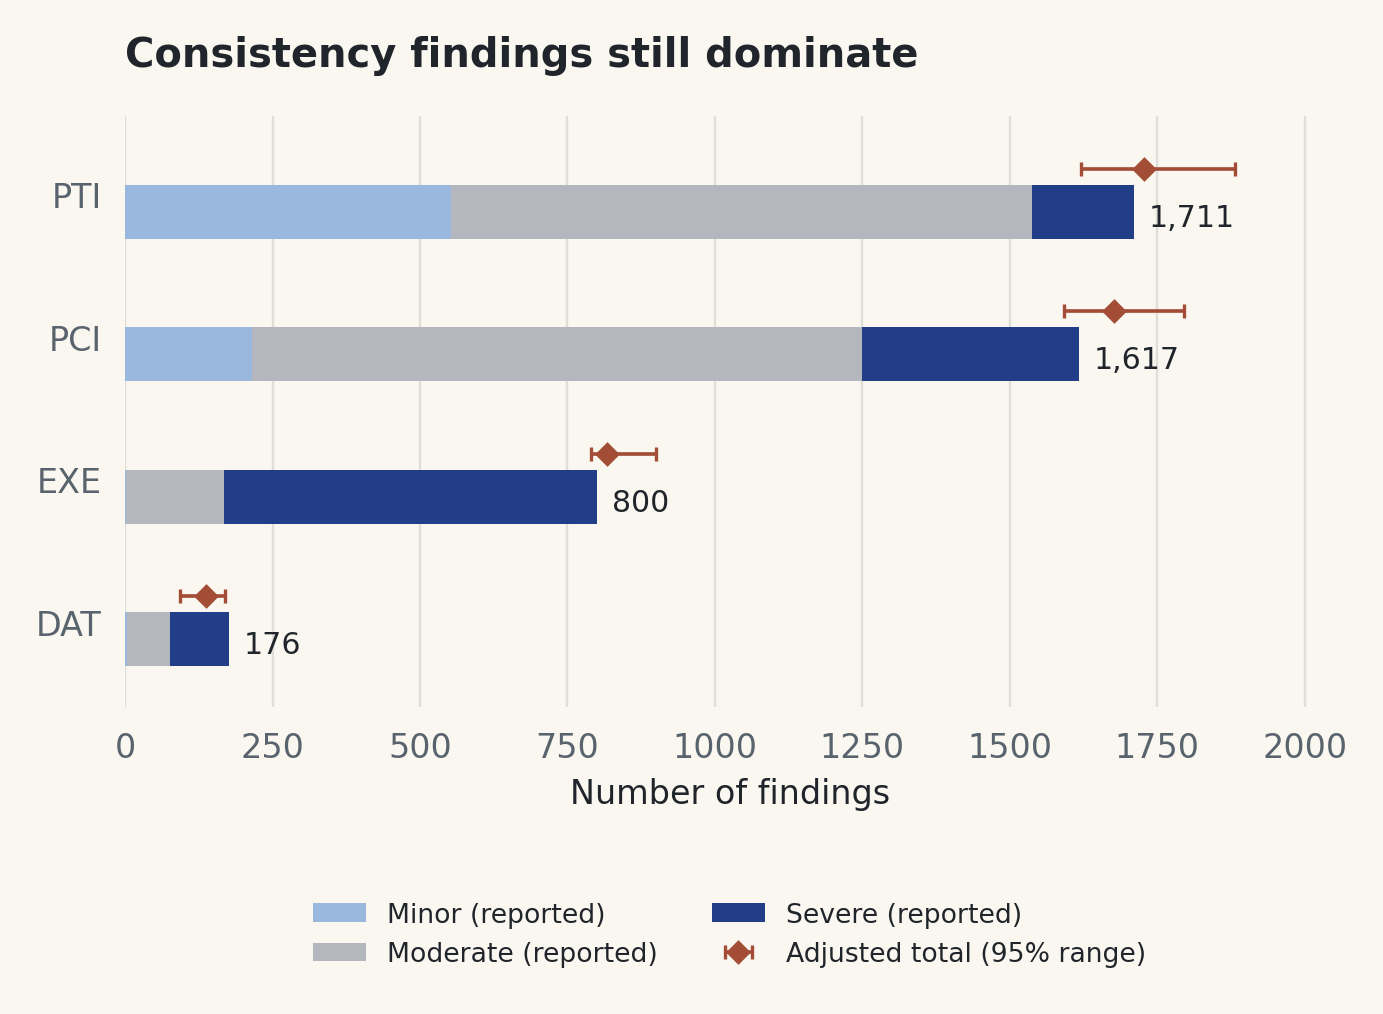
We do not regard CRED as final or optimal; we expect to update and refine it. Figure 1: severity as reported; adjusted totals with 95% ranges, each computed separately, under proportional misses. See Verifying the verifiers for the classification and validation approach, and the sections below for the adjustment's assumptions.
The question
Can an automated research system produce policy evaluations that survive inspection? We examined 1,000 papers from Project APE's January–April 2026 run, using the latest available version per paper ID; revisions are not additional observations.
Using Codex 5.5 at high reasoning effort, CRED v0.92 read each manuscript, its code and reproduction records. It flags prose contradicting tables or figures (PTI), manuscripts disagreeing with their code (PCI), execution or reproduction failures (EXE), and data-integrity problems (DAT). Causal claims are not assessed.
What we found
The verifier reported 4,304 findings: 4.3 per paper on average, median four. It had no quota and was free to report nothing, yet it flagged every paper, 941 for something besides execution. It rated at least one finding severe in 842 papers.
The verifier can raise false alarms and overlook real problems. Adjusting for both gives 4.4 findings per paper (4.2–4.6). The 95% range reflects uncertainty about false alarms and missed errors.
What the result means
Our system repeatedly produced papers whose prose, tables, code and data handling disagreed, or whose results we could not reproduce under the conditions tested.
In 100 eligible R-only papers, human reviewers confirmed 449 of 461 findings, at least one in every paper.
Generation Pipeline
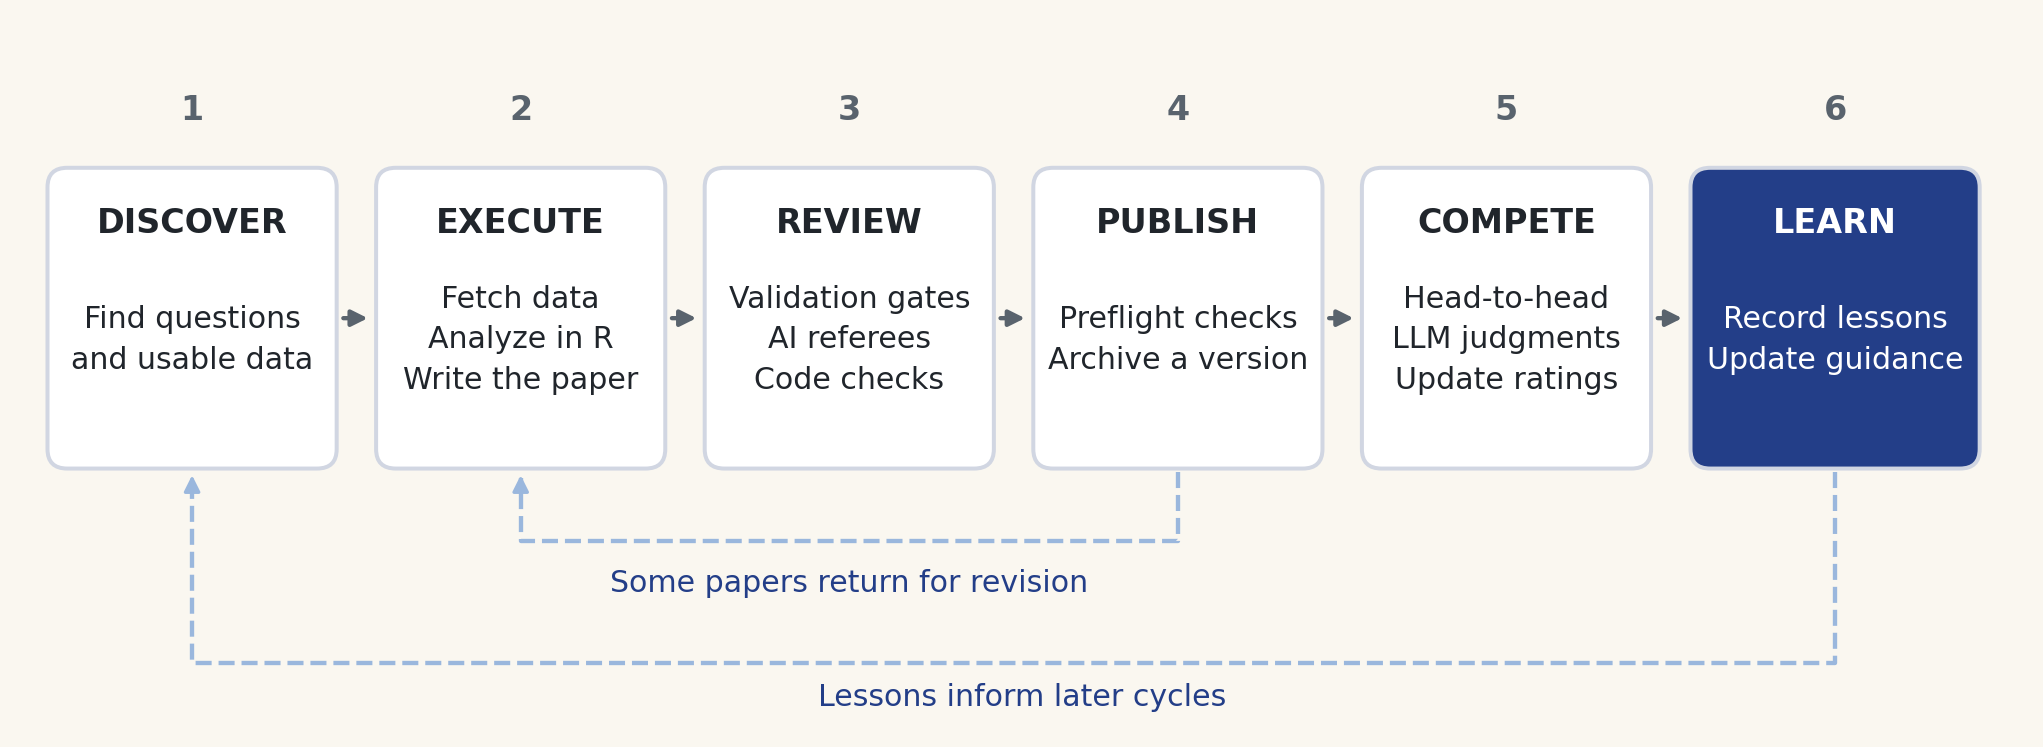
Our agents found research questions, fetched data, wrote code and manuscripts, and reviewed the results. Our team at Social Catalyst Lab (SCL) refined the workflow throughout the run.
 ↗ Enlarge figure
 ↗ Enlarge figure
A changing research loop
The diagram outlines the workflow; not every paper followed the same steps. We archived published versions, and some papers returned for revision. LLM judges compared papers head to head, and recorded lessons shaped later runs.
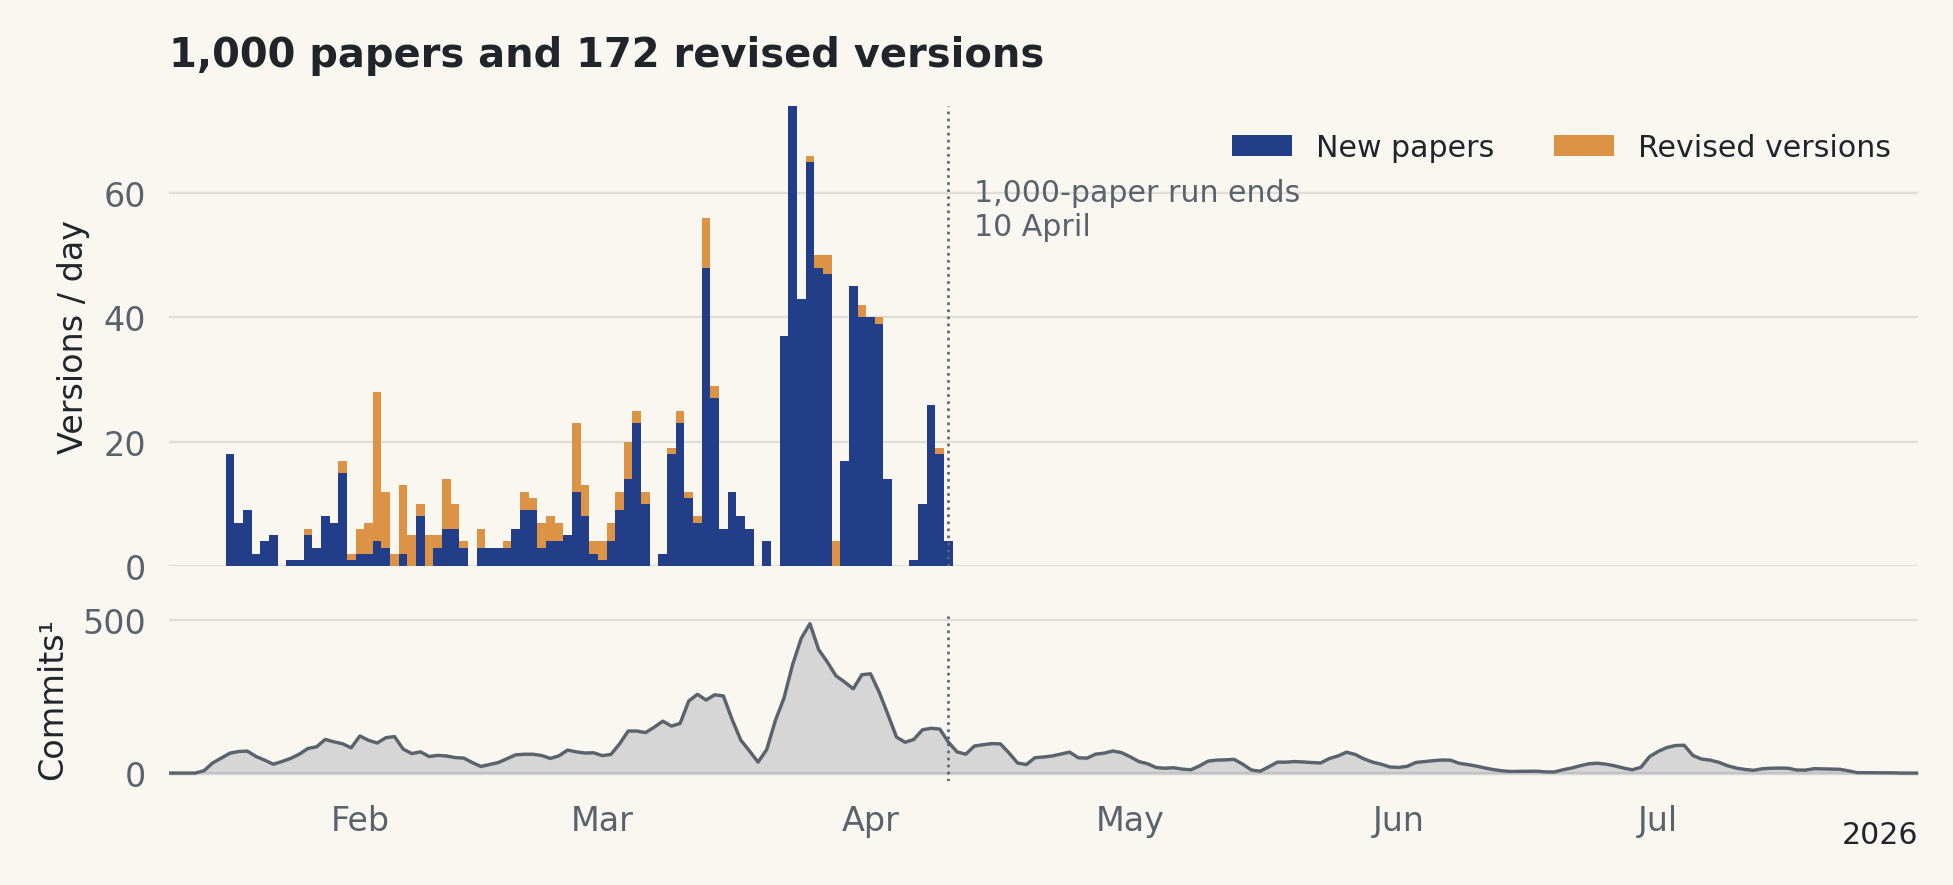
The run produced 1,000 new papers and 172 revised versions. We analyze the 1,000 papers on our fixed evaluation list, not all 1,172 published versions.
Changes during production
In January we merged production and revision instructions; in February we closed ways to skip publication checks. On 11 March we introduced a shorter first-draft format with one or two randomized reviewers, on 25 March a Claude–Codex coauthor workflow, and on 29 March a consistency check.
Models, tasks, formats and checks changed together, so these dates show what changed and when, not what each change did to errors.
Review is not verification
A referee can find an argument persuasive without checking that the code implements it. Code can run while the manuscript describes a different analysis.
We applied CRED after production, to fixed versions of the papers. This audit is our own, not external certification; Codex also took part in some generation workflows. Our methods explain how tournament judgments assess scientific value, separately from whether claims and implementation agree.
Which problems were most common?
How widely problems spread
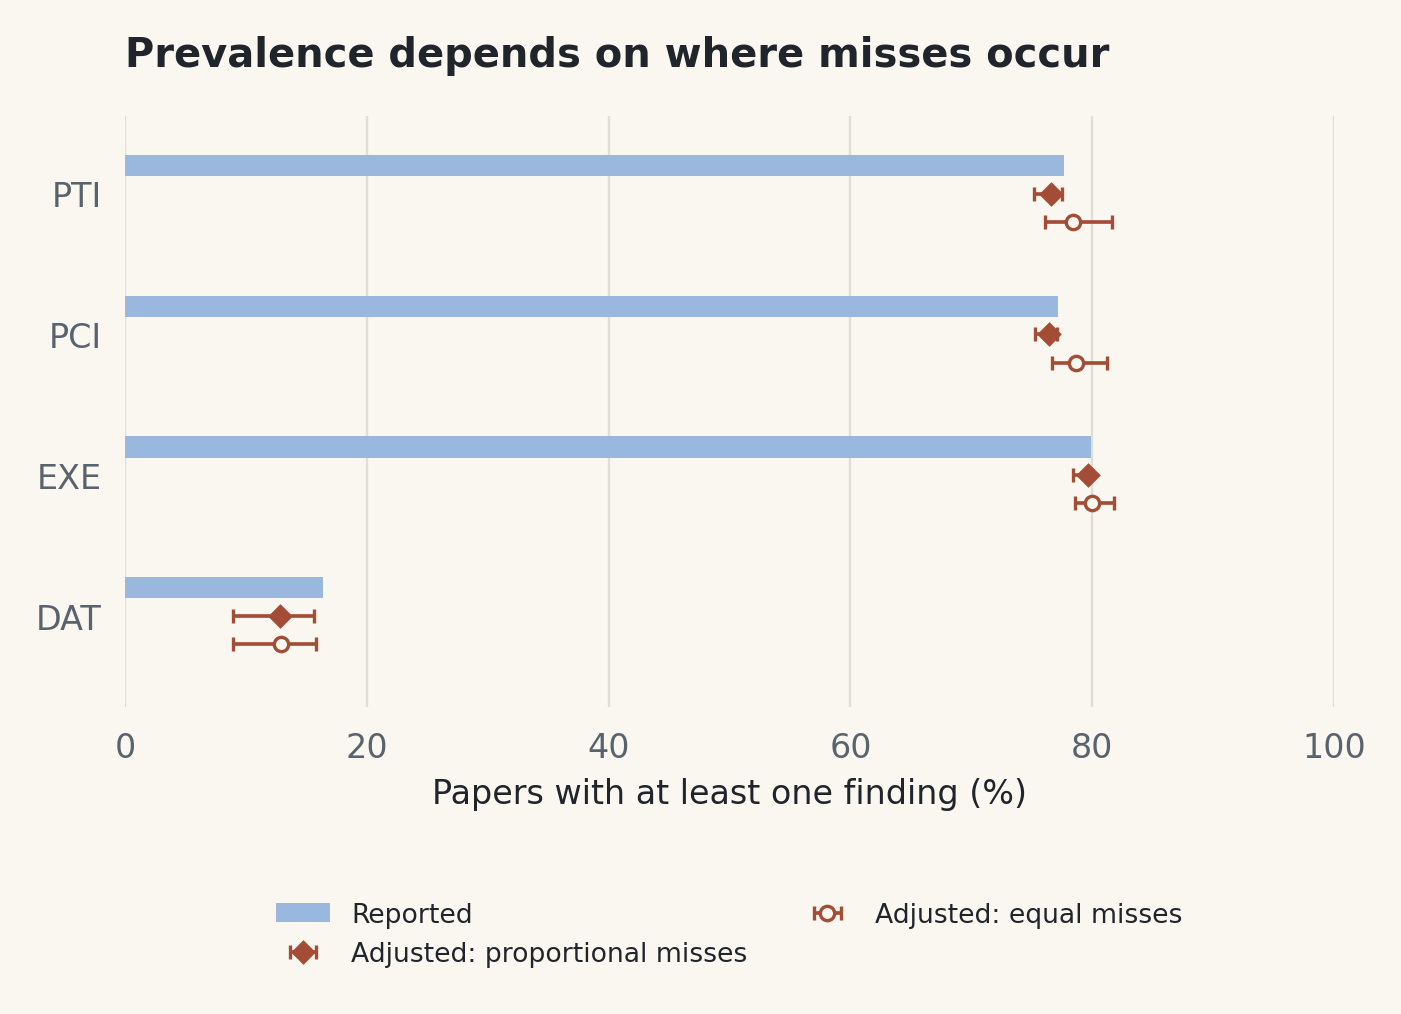
The verifier reported execution or reproduction findings (EXE) in 799 papers, prose–table inconsistencies (PTI) in 777, paper–code inconsistencies (PCI) in 772 and data-integrity findings (DAT) in 164. These groups overlap.
For DAT, the adjustment lowers the share of papers affected from 16.4% to 12.8%, or 12.9% if we spread misses equally. That drop rests on our assumptions and only 14 reviewed findings: 11 confirmed, two out of scope, one unclear, and none called a false alarm.
 ↗ Enlarge figure
What fills the reports
Inconsistencies account for 3,328 of 4,304 findings, or 77%: gaps between what readers are told and what tables show or code does. A report may list several inconsistencies but almost always records execution once. We count each finding once, under its main category. Several findings can describe the same mistake, so the number of distinct errors could be lower than 4,304.
Of 1,273 findings rated severe, 633 concern execution or reproduction. A rerun can fail because inputs are missing or its execution environment has changed.
 ↗ Enlarge figure
What the adjustments can tell us
Our tests help estimate how many findings are false alarms and how many errors were missed, but not where they occur. False alarms concentrated in papers with few findings could leave more papers without defects.
We show two ways of placing missed errors: in proportion to each paper’s findings in that category, or equally across papers. Both assume independent false alarms. Neither corrects category labels or severity: the verifier detected 85 of 90 introduced PCI errors but correctly classified only 81.
Overall, these adjustments show the main results are robust to the fact that the verifier is imperfect.
Examples of errors
We chose these cases for clarity from findings that human reviewers judged genuine. They illustrate mechanisms and are not a random sample of errors.
Negative in the prose, positive in the table
The table: the six cited coefficients
are all positive.
In a study of wilderness designation and forest harvesting, the discussion says the estimates stay negative across six bandwidths. Every coefficient in the row it cites is positive, so a reader who trusted the sentence would expect the opposite sign from the table's.
The prose and the table contradict each other; that alone does not tell us which reports the correct result.
Paper 0913, v1: manuscript discussion of bandwidths; Table 3.
County data in the description, state data in the code
The code: WHERE geo_level = 'S'
The output is labeled state_fips.
A paper on online sales taxes describes a county-level query. Its data-fetch script selects state-level records and treats the geographic identifier as a state identifier, so the manuscript and the code disagree about what data were obtained.
The mismatch lies in how the paper describes building its data; on its own, it does not show that every later estimate uses the wrong unit.
Paper 0609, v1: data-query description; data-fetch script.
A table script asks for a variable that is absent
The rerun: object 'driver_age' not found
The table script exits with an error.
In a study using traffic-fatality records, the recorded rerun reaches a table-building step that computes average driver age. The variable is missing and the script fails, so a reader cannot regenerate the tables simply by running the supplied package under those conditions.
This is direct evidence that the rerun failed, not proof that the table was never produced in another environment or from data in another state.
Paper 0091, v1: table-generation code; archived reproduction log.
When a download fails, four hand-entered locations take its place
create four named dispensary locations;
save them as dispensaries_sf.rds.
A study of cannabis dispensary locations includes a fallback in case its map-data request fails. It creates four hand-entered locations and saves them to the same file a successful download would produce, so later steps can continue with a far narrower substitute.
The code shows the fallback exists, not that it ran when the published results were generated. The defect is letting an inadequate substitute stand in for the intended data.
Paper 0110, v4: data-fetch script, failed-request branch.
These records show where each defect sits, not when it arose. An incorrect sentence may survive editing, a mismatched data description may survive review, and a fallback may let a run continue when it should stop. Those are plausible routes we have not tested.
How we checked the findings
We assess two things separately: whether code runs and reproduces the tables, and whether the verifier reliably identifies errors.
What the reruns recorded
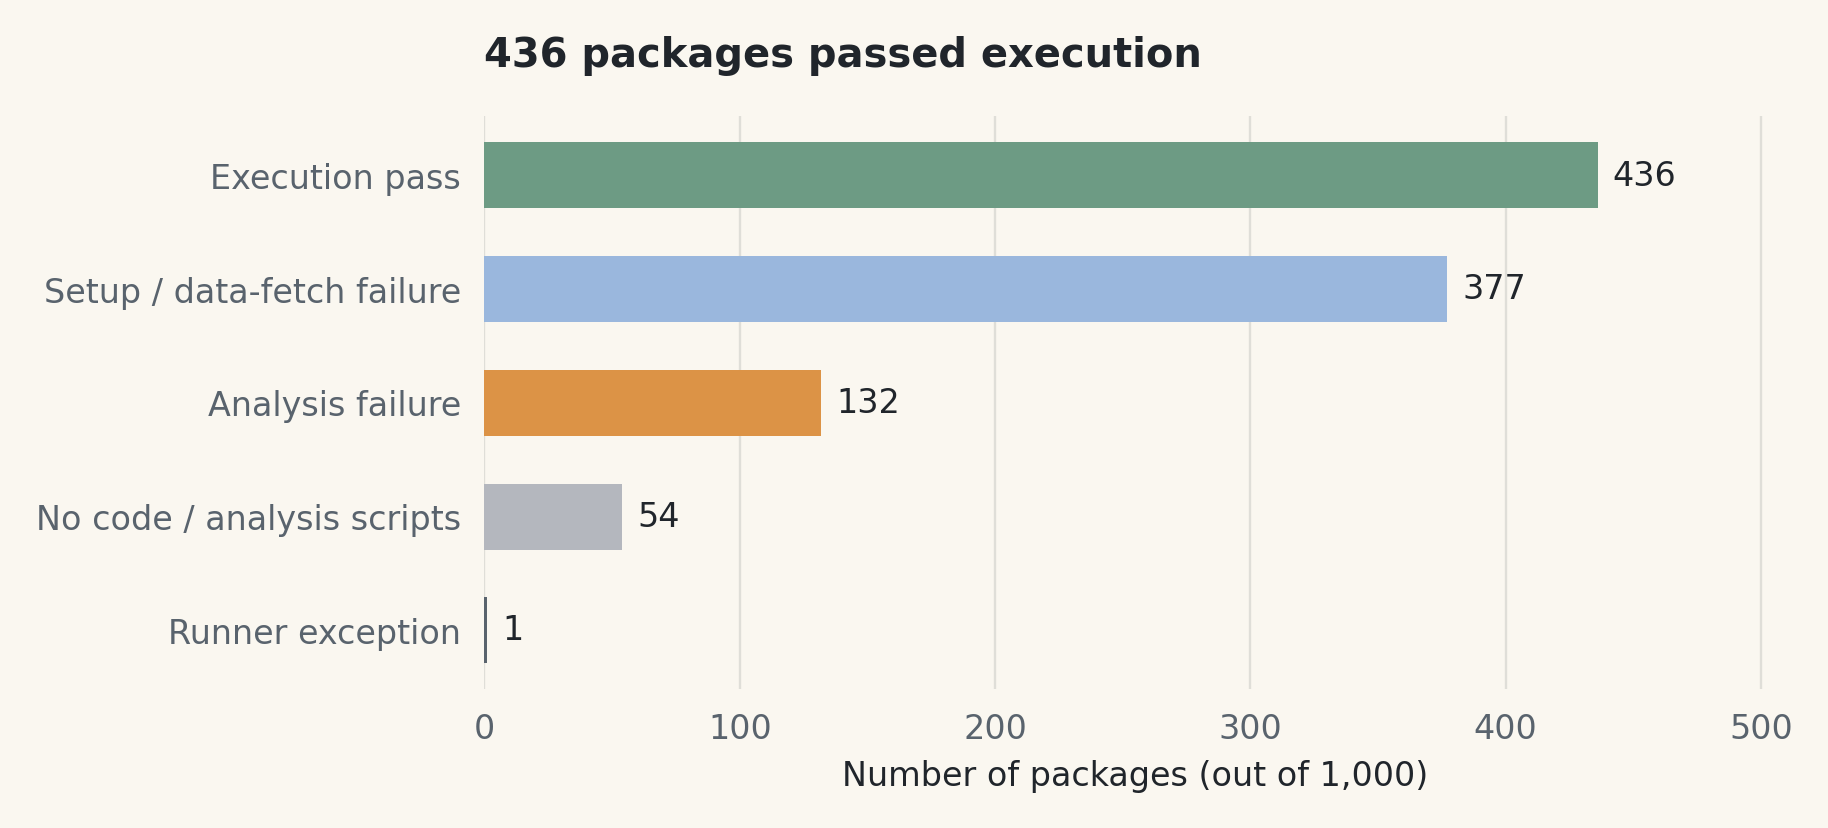
We examined reproduction records dated 24 April to 7 May. Code ran in 436 of 1,000 cases; the figure shows the other outcomes. Among the 436, 144 passed published-table checks, 288 failed and four were not applicable.
The verifier read these records alongside the manuscript and code.
 ↗ Enlarge figure
The verifier flagged 799 papers under EXE: all 564 without an execution pass, plus 235 of the 288 table-check failures. The other 53 received no EXE finding, and we have not established why. Rerun outcomes and EXE findings are related but not interchangeable.
Two tests of the verifier
We test whether findings are genuine and whether errors are caught.
Two human reviewers independently assessed 461 findings on 100 unmodified papers, then by consensus confirmed 449, at least one in every paper. We sampled eligible R-only papers at random within research-method groups.
We introduced 200 errors, one per test, into 100 separate, selected reproducible papers; the verifier detected 193.
| Category | Confirmed by reviewers | Detected in any category |
|---|---|---|
| Total | 449/461 (97%) | 193/200 (97%) |
| PTI | 129/134 (96%) | 48/50 (96%) |
| PCI | 168/172 (98%) | 85/90 (94%) |
| EXE | 141/141 (100%) | 20/20 (100%) |
| DAT | 11/14 (79%) | 40/40 (100%) |
Detection credits an introduced error found under any category. It does not require the verifier to assign the correct category.
How do we adjust for imperfect verification?
The papers and reported findings stay fixed. We assess uncertainty in the adjustment by repeating it 20,000 times, allowing for false alarms and missed errors at rates informed by our validation tests. The whiskers show the resulting 95% ranges. They assume the verifier performs similarly in the tests and in these papers, and that false alarms occur independently.
Concluding Remarks
The first 1,000 papers give us a baseline for a more ambitious phase of Project APE. We are developing a multi-agent research system in which agents investigate questions, challenge results and revise their work. We want it to learn from experience and improve how it conducts later research.
Structured experimentation is essential. In this first phase, models, instructions and review procedures changed together. We will compare alternatives on common research tasks, with randomized assignment and consistent evaluation, to learn which changes improve reliability and scientific value, and at what cost.
Self-improvement remains a hypothesis to demonstrate.
Sources: Project APE, Verifying the verifiers, and the public papers and code. Evaluation: CRED v0.92; Codex 5.5 high. Descriptive counts cover all 1,000 papers.